Mass data aggregation display method based on map

A technology of aggregated display and massive data, applied in geographic information database, still image data retrieval, still image data browsing/visualization, etc. Effects of performance issues

Inactive Publication Date: 2017-09-08
南京英斯特网络科技有限公司
View PDF5 Cites 8 Cited by
  • Summary
  • Abstract
  • Description
  • Claims
  • Application Information

AI Technical Summary

Problems solved by technology

[0003] The biggest difference between the front-end display of massive data and the traditional display technology is that the amount of data has become very large. Since most of the traditional map engines are based on relational databases, the query speed is already very slow when the amount of data reaches millions. The efficiency of online display is even lower, and the system based on big data often has more than billions of data, and the corresponding amount of data to be displayed is also large, so there is an urgent need for a m...

Method used


Image

  • Mass data aggregation display method based on map
  • Mass data aggregation display method based on map
  • Mass data aggregation display method based on map

Examples


Embodiment 1

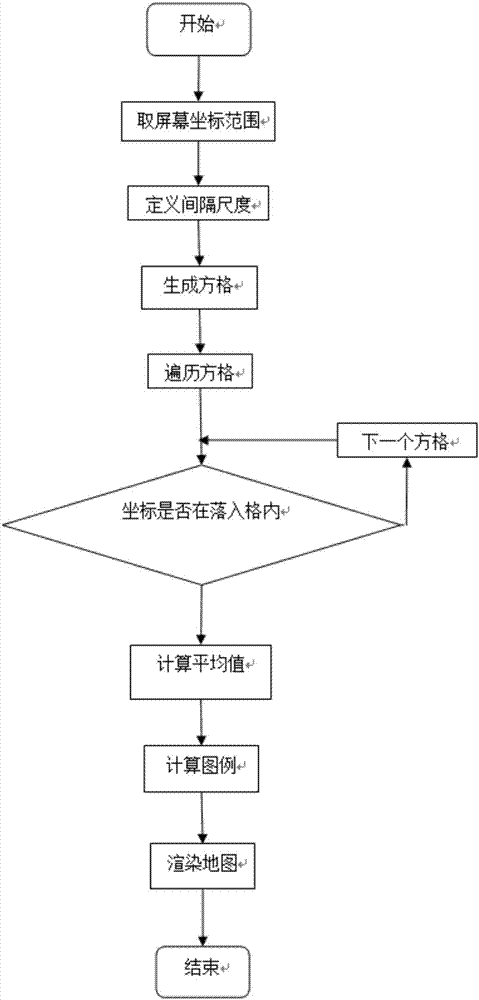
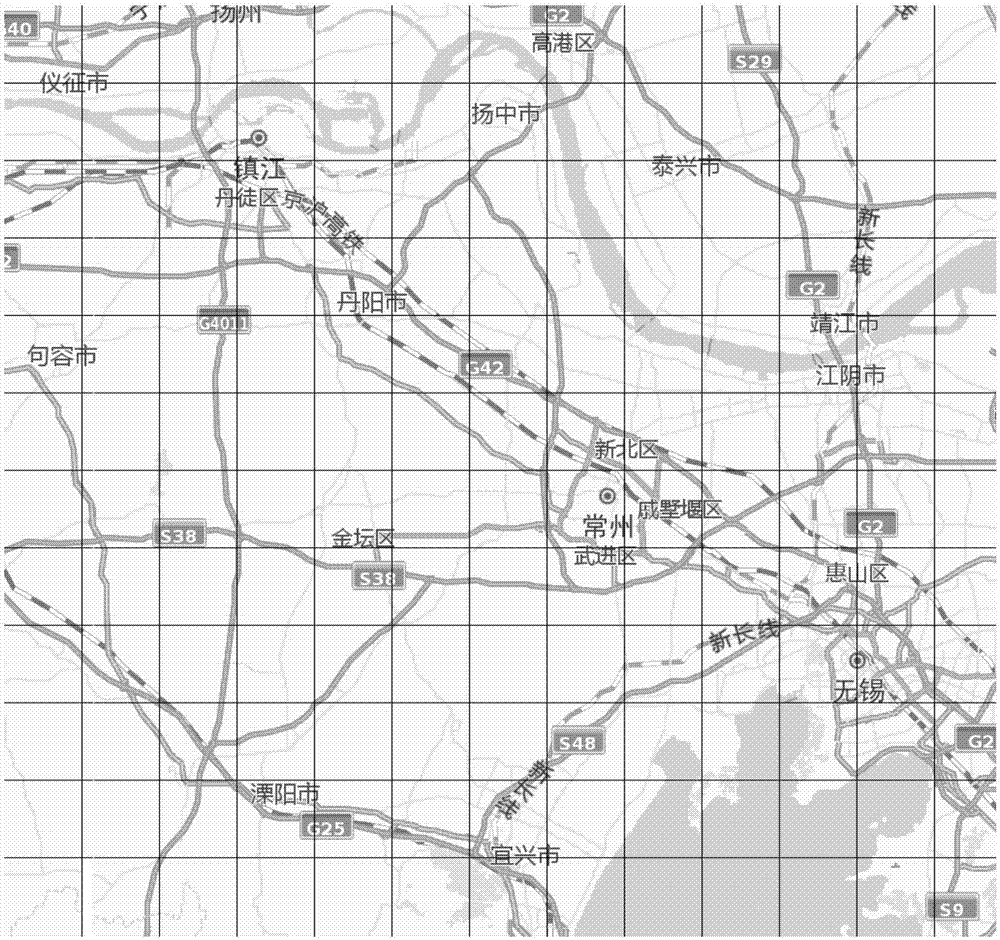
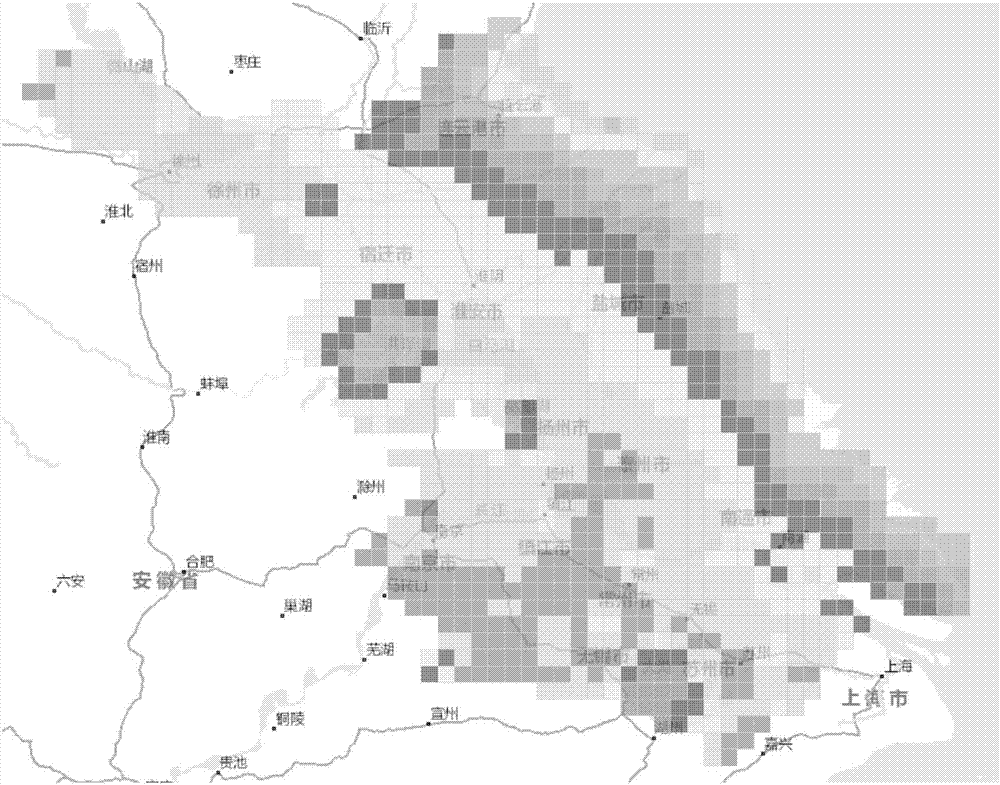
[0030] Taking the fine weather forecast grid data as an example, using the Gaode map as the base map, first take the minimum coordinates and maximum coordinates through the coordinates of the current screen display range, define the interval scale, generate a grid, and judge the grid point values ​​in turn. Coordinate drop point, calculate the average value of the data falling into the same grid to obtain a series of representative points, and record the maximum and minimum values ​​of the representative points within the screen range and round them up, and calculate according to the pre-defined legend color scale The range of values ​​that each color corresponds to.

[0031] Call the Polygon class of Gaode map to draw the cover in a loop, and calculate the node coordinate array of the contour line according to the longitude long and latitude lat of the representative point according to the calculation: [new AMap.LngLat((long,lat)),new AMap.LngLat( (long+interval / 1000,lat)),ne...

Embodiment 2

[0035] Taking the vehicle monitoring system as an example, take the AutoNavi map as the base map, take the minimum and maximum values ​​of the current screen coordinates, define the interval scale, generate a grid, take out all the vehicle information to be displayed, and take out the current coordinates of the vehicle in a loop, which will fall into the same The grid vehicle data is accumulated to get how many vehicles are aggregated in the same area, and the grid coordinates are used as representative points.

[0036] Call the Marker class of the Gaode map to add icons of the marker layer in a loop. The display position of the marker is the coordinate position of the representative point, and the display content of the marker is the sum of the number of vehicles at the representative point.

[0037] To sum up, through the aggregation algorithm, a large amount of vehicle data can be displayed on the map at a high speed and efficiently, and users can check the number and locati...


PUM


Abstract

The invention discloses a mass data aggregation display method based on a map. The method includes the specific steps that firstly, any one map is called to serve as a base map; secondly, a grid covering layer is added to the called map, wherein the number of grids in the grid covering layer is the number of data which needs to be displayed currently; thirdly, the data needing to be displayed is obtained from a server, the data is traversed so as to be compared with the longitude and latitude range contained in each grid, and the data in the same grid are aggregated, wherein the aggregating mode can be determined according to needs; fourthly, after the aggregated data which needs to be displayed on a current screen is obtained through the first three steps, all the data is positioned to the longitudes and latitudes of the grids corresponding to the data and rendered into the map, that is, the aim of data aggregation display is achieved. When the aggregation display method is used, the data with neighboring geographic positions is aggregated into one data point, and the data is obtained according to the longitude and latitude range of the current screen and displayed so as to achieve the aim that the map labeling data is displayed at a high speed.

Description

technical field [0001] The invention relates to a map-based massive data aggregate display method, which belongs to the technical field of map massive data aggregate display. Background technique [0002] The rapid development of Internet technology has brought more and more various information products, especially in the past two years, the gradual maturity of big data technology has provided more refined data support for the management of large government enterprises, such as the map display based on massive data There are more and more applications of command management and dispatching systems. [0003] The biggest difference between the front-end display of massive data and the traditional display technology is that the amount of data has become very large. Since most of the traditional map engines are based on relational databases, the query speed is already very slow when the amount of data reaches millions. The efficiency of online display is even lower, and systems ...

Claims


Application Information

Patent Timeline
IPC IPC(8): G06F17/30
CPCG06F16/29G06F16/54
Inventor 夏霆喻宇
Owner 南京英斯特网络科技有限公司
Why Eureka
Try Eureka