
An electrocardiogram data display method and a terminal apparatus

A display method and electrocardiogram technology, which is applied in the field of medical data analysis, can solve problems such as failure to find abnormal waveforms, and achieve a clear display effect

Active Publication Date: 2017-09-15
陈一昕
View PDF8 Cites 3 Cited by
  • Summary
  • Abstract
  • Description
  • Claims
  • Application Information

AI Technical Summary

Problems solved by technology

[0004] In view of this, the embodiment of the present application provides a display method and terminal equipment for electrocardiogram data to solve the technical problem in the prior art that abnormal waveforms cannot be found by using scatter diagrams

Method used


Image

  • An electrocardiogram data display method and a terminal apparatus
  • An electrocardiogram data display method and a terminal apparatus
  • An electrocardiogram data display method and a terminal apparatus

Examples


Embodiment Construction

[0014] The present application is described below based on examples, but the present application is not limited only to these examples. In the following detailed description of the application, some specific details are set forth in detail. The present application can be fully understood by those skilled in the art without the description of these detailed parts. To avoid obscuring the essence of the present application, well-known methods, procedures, procedures, components and circuits have not been described in detail.

[0015] Additionally, those of ordinary skill in the art will appreciate that the drawings provided herein are for illustrative purposes and are not necessarily drawn to scale.

[0016] Unless the context clearly requires, throughout the specification and claims, "comprises", "comprises" and similar words should be interpreted in an inclusive sense rather than an exclusive or exhaustive meaning; that is, "including but not limited to" meaning.

[0017] In...


PUM


Abstract

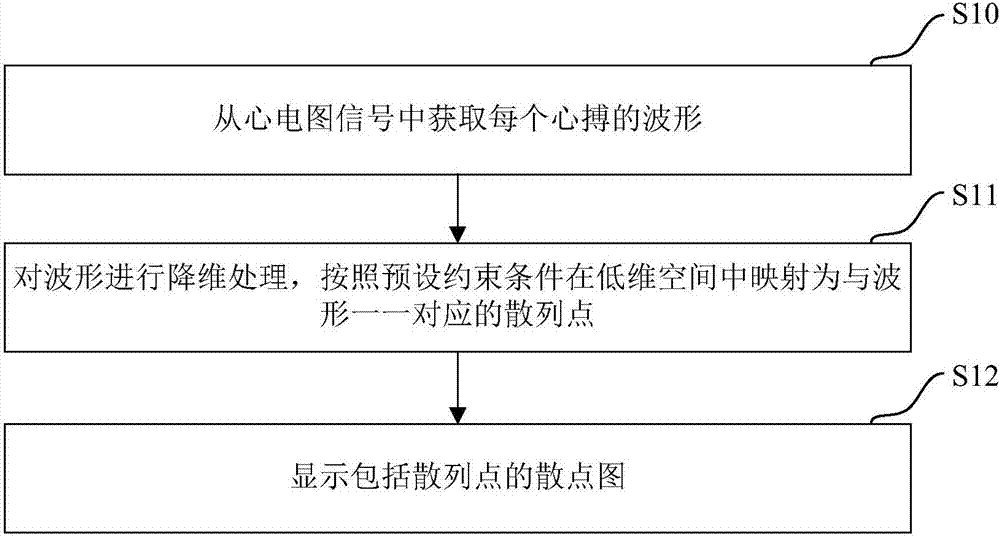
The invention provides an electrocardiogram data display method and a terminal apparatus. The method comprises the steps of acquiring the waveform of each heart beat from electrocardiogram signals, performing dimension reduction processing on the waveforms, and mapping the waveforms in a low-dimension space into hash points corresponding to the waveforms in a one-to-one manner according to preset constraint conditions; displaying a scatter plot including the hash points. Compared with the conventional Lorenz plot which is drawn via R-R intervals and can only reflect the exception of rhythms, the scatter plot formed in the embodiments of the invention enables waveform exceptions to be discovered and enables hash points to be displayed more clearly in limited space.

Description

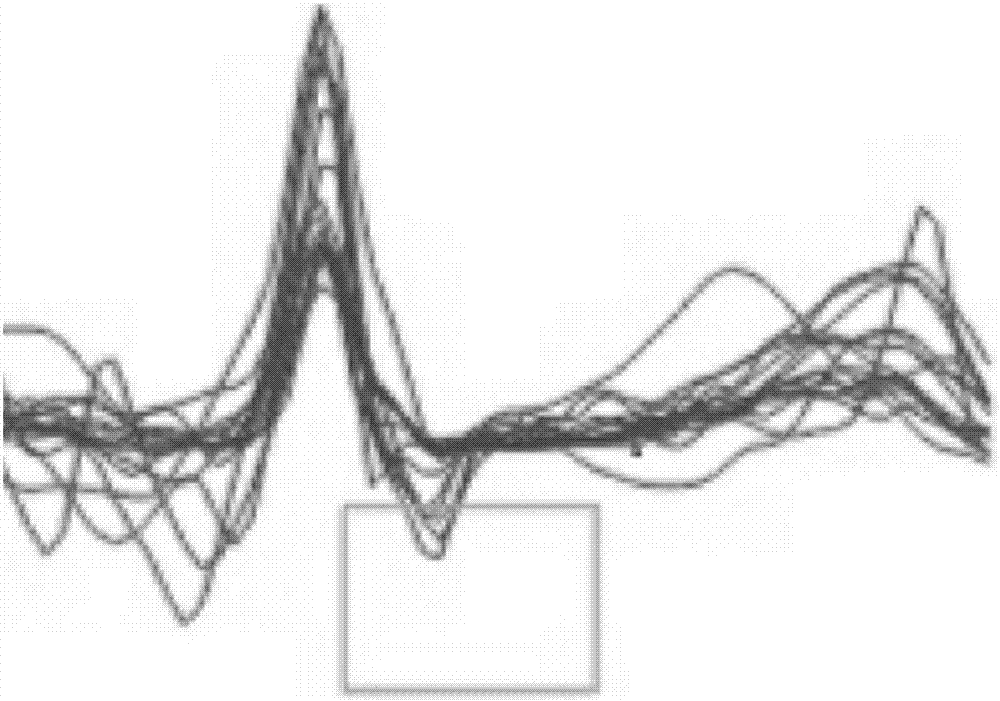
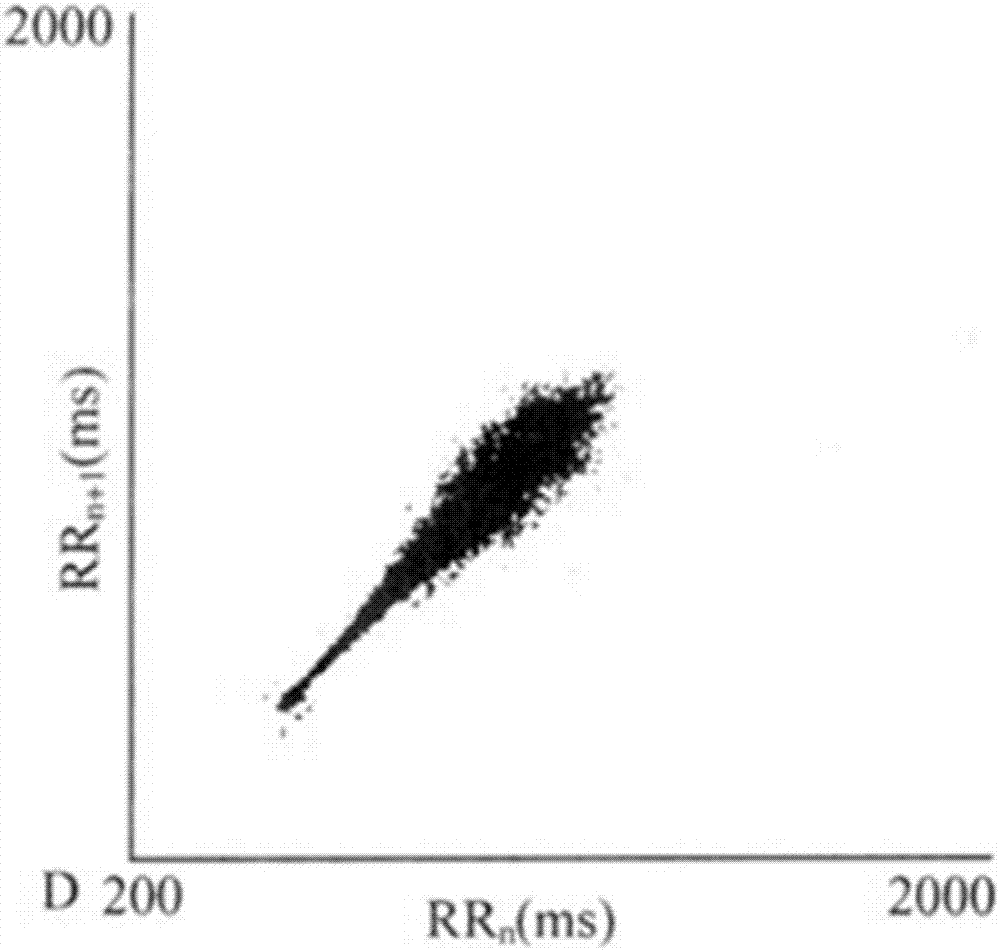
technical field [0001] The present application relates to the field of medical data analysis, in particular to a display method and terminal equipment for electrocardiogram data. Background technique [0002] An electrocardiogram (ECG) is used to record the pattern of electrical activity changes produced by the heart in each cardiac cycle. At present, the dynamic electrocardiogram visualization system presents the heartbeat as concentrated as possible on a two-dimensional plane. There are two common visualization methods, one such as figure 1 As shown, multiple heartbeat waveforms are drawn on one graph, and weird waveforms are selected and marked; another such as figure 2 As shown in , the Lorenz scatter diagram is drawn through the adjacent beat interval (R-R interval), and the outlier points are specially selected and marked. [0003] Both approaches have their inherent flaws. The first one directly draws the waveforms of multiple heartbeats together. When the amount...

Claims


Application Information

Patent Timeline
IPC IPC(8): A61B5/044
CPCA61B5/339
Inventor 陈一昕
Owner 陈一昕
Learn More