Multithread analysis and operation visualization method

A multi-threading and threading technology, applied in the field of data analysis, can solve problems such as inability to extract valid data, laborious analysis by engineers, and large amount of data, so as to shorten the construction period of software engineering, improve R&D efficiency, and facilitate access

Active Publication Date: 2017-09-15
福建星瑞格软件有限公司
View PDF3 Cites 4 Cited by
  • Summary
  • Abstract
  • Description
  • Claims
  • Application Information

AI Technical Summary

Problems solved by technology

However, in practice, this method has limited contribution to log analysis. When it comes to multi-threaded programs or large-scale projects with more than 200

Method used


Image

  • Multithread analysis and operation visualization method
  • Multithread analysis and operation visualization method

Examples


Embodiment Construction

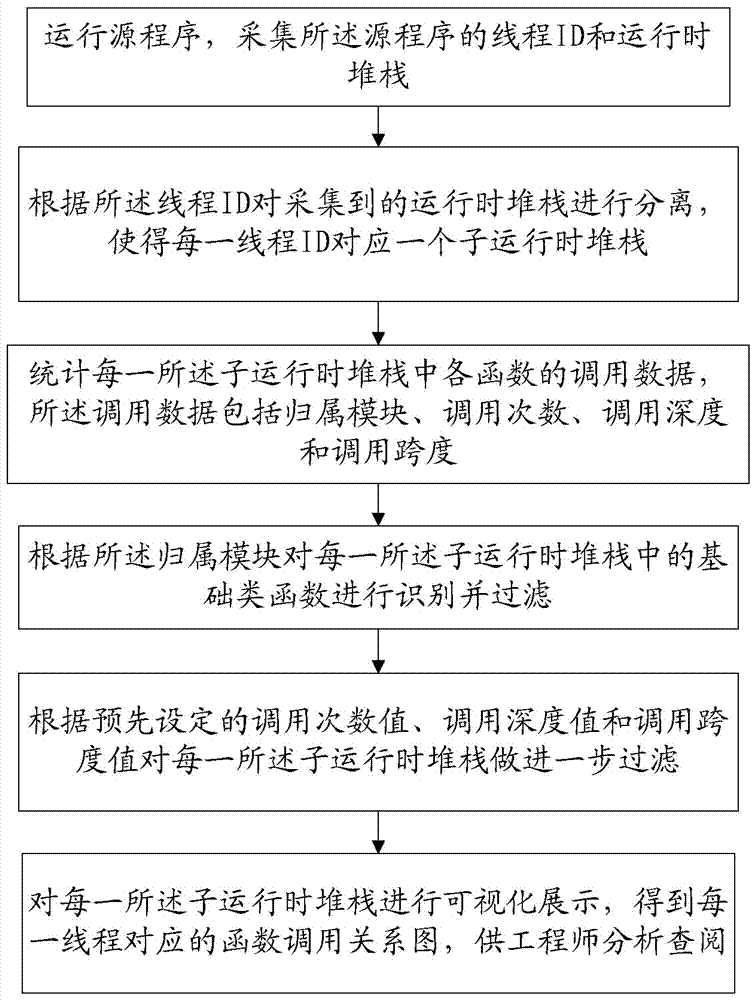
[0021] like figure 1 As shown, a multi-thread analysis and operation visualization method includes the following steps:

[0022] Step 1, run source program, gather the thread ID and run-time stack of described source program, described thread ID directly calls operating system thread api and obtains by an external program, and described run-time stack is compiled by compiler (as GNU) device) to add a flag, and then get it through the proxy function;

[0023] Step 2, separating the collected runtime stacks according to the thread ID, so that each thread ID corresponds to a sub-runtime stack;

[0024] Step 3, counting the call data of each function in each of the sub-runtime stacks, the call data includes the attribution module, the number of calls, the call depth and the call span, and the attribution module includes a memory allocation module, a file operation module and a lock module;

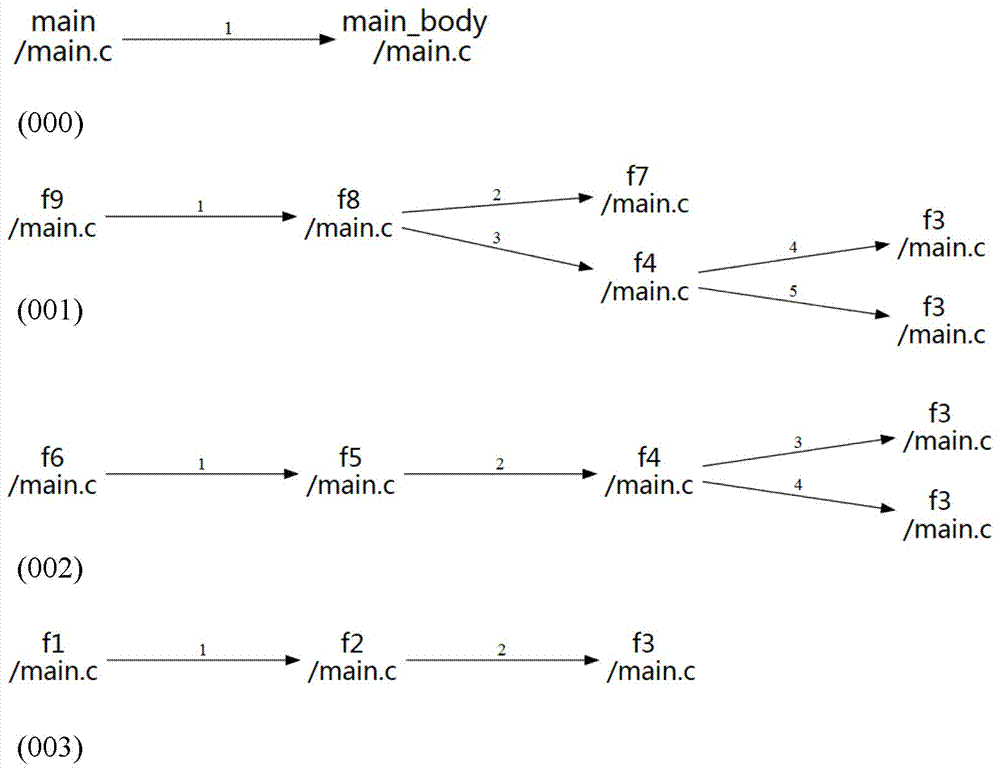
[0025] Step 4. Identify and filter the basic class functions in each of the sub-runtime...


PUM


Abstract

The invention provides a multithread analysis and operation visualization method. The method comprises the following steps of: operating a source program and acquiring thread IDs and a runtime stack of the source program; separating the runtime stack according to the thread IDs to ensure that each thread ID corresponds to one sub-runtime stack; carrying out statistic on calling data of each function in each sub-runtime stack, wherein the calling data comprises an attribution module, a calling frequency, a calling depth and a calling span; identifying and filtering basic class function in each sub-runtime stack according to the attribution module; further filtering each sub-runtime stack according to a preset calling frequency value, a preset calling depth value and a preset calling span value; and carrying out visualized display on each sub-runtime stack so as to obtain a function calling relationship graph corresponding to each thread. According to the method provided by the invention, the screening analysis and visualized display of multithread operation data are realized, effective source program analysis basis is provided for the engineers and the software development efficiency is improved.

Description

technical field [0001] The invention relates to the technical field of data analysis, in particular to a multi-thread analysis and operation visualization method. Background technique [0002] At present, many projects have a large number of source code lines and are executed in parallel by multiple threads. If you need to modify the source code on this basis, you need to find the required functions and make targeted modifications. However, if there are many source code lines It is not an easy task to find a certain function or analyze its code structure, etc., mainly through human inspection and analysis. In order to help engineers analyze the source code, some tools (such as GNU compiler tool chain ) to obtain runtime stack records when running the source code, analyze and find out the required functions from the running logs, which reduces the difficulty of program analysis to a certain extent. [0003] Existing tools for analysis of stack records at runtime mainly invol...

Claims


Application Information

Patent Timeline
IPC IPC(8): G06F11/30G06F11/32
CPCG06F11/3017G06F11/3051G06F11/324
Inventor 林禹林畅辉
Owner 福建星瑞格软件有限公司
Why Eureka
Try Eureka