Estimation Method of Non-point Pollution Source Intensity Based on Accurate Retrieval of Crop Information Remote Sensing

A pollution source intensity, non-point source technology, applied in the field of non-point source pollution source intensity estimation, can solve the problems of pollution accumulation process, lack of dynamic data support, errors, etc., to achieve the effect of accurate estimation

Active Publication Date: 2020-08-11
HOHAI UNIV +1
View PDF7 Cites 0 Cited by
  • Summary
  • Abstract
  • Description
  • Claims
  • Application Information

AI Technical Summary

Problems solved by technology

Traditional sampling or monitoring methods have limitations in spatial distribution and time span, lack of dynamic data support, resulting in unclear pollution accumulation process
In addition, the non-point source pollution produced by different crops is different. At present, the classification of crop types is not clear, and uniform standards are often used to estimate the intensity of pollution sources, resulting in insufficient accuracy.
For the estimation of the intensity of large-scale non-point source pollution sources, when estimating the amount of fertilization in farmland, due to the lack of accurate phenological information, it is difficult to estimate the amount of fertilization for different crops in different regions by traditional methods, and the growth cycle of the entire crop is often used as a parameter To calculate, it is easy to cause a large error when there are multiple crops
[0009] To sum up, the current non-point source pollution models at home and abroad are biased towards application, and the model has obvious regional characteristics, which is not conducive to popularization. Due to the lack of detailed monitoring data of various aspects of non-point source pollution loads measured in the field, the uncertainty of the model exists. Influenced by nature, etc., the simulation results lack effective verification and lack of reliability

Method used


Image

  • Estimation Method of Non-point Pollution Source Intensity Based on Accurate Retrieval of Crop Information Remote Sensing
  • Estimation Method of Non-point Pollution Source Intensity Based on Accurate Retrieval of Crop Information Remote Sensing
  • Estimation Method of Non-point Pollution Source Intensity Based on Accurate Retrieval of Crop Information Remote Sensing

Examples


Embodiment Construction

[0037] The present invention will be further described below in conjunction with the accompanying drawings. The following examples are only used to illustrate the technical solution of the present invention more clearly, but not to limit the protection scope of the present invention.

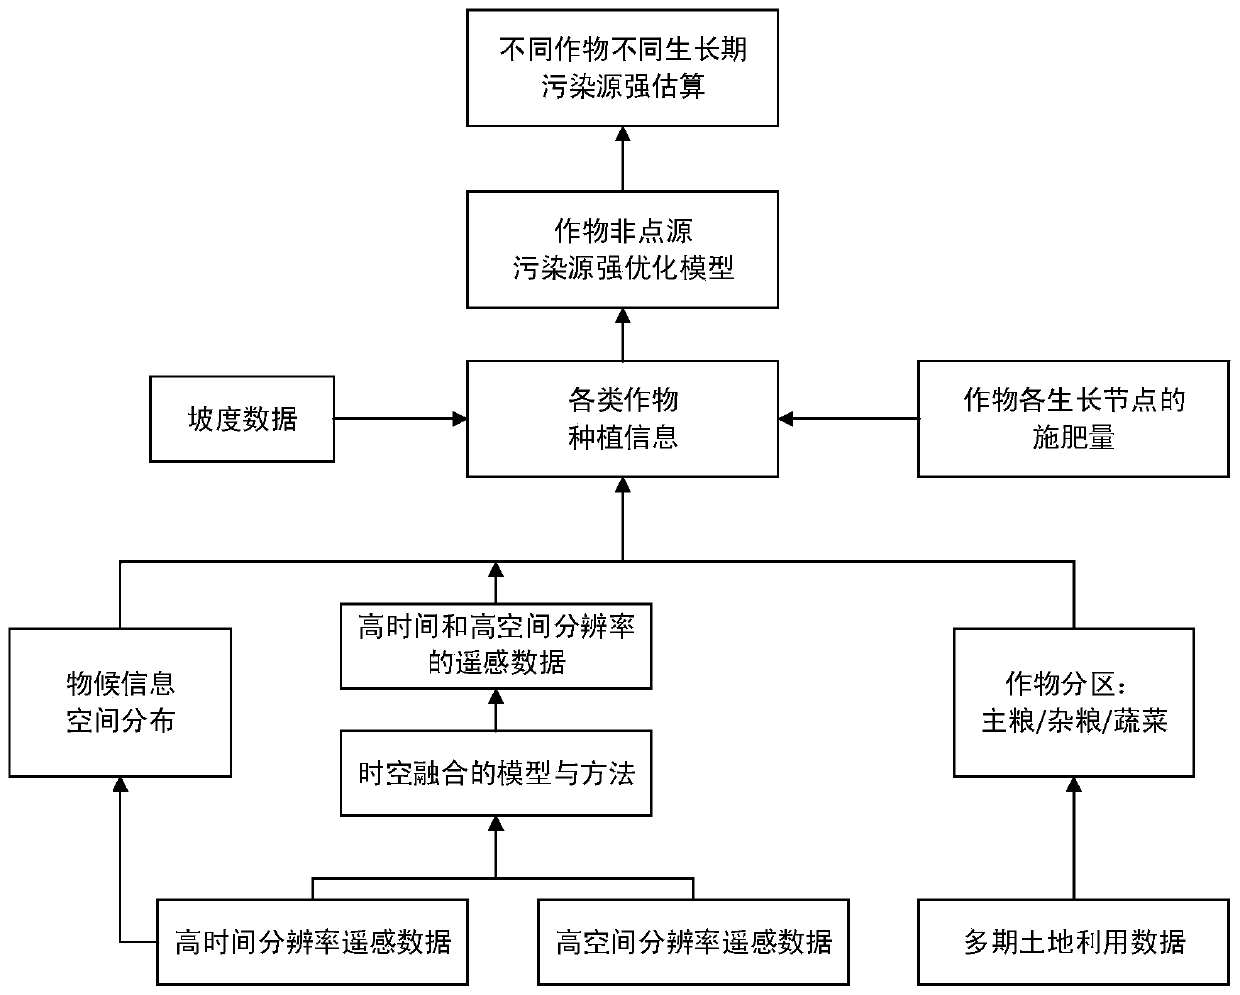
[0038] Such as figure 1 As shown, a method for estimating the strength of non-point source pollution sources based on the accurate inversion of crop information remote sensing of the present invention comprises the following steps:

[0039] Step S1, obtaining continuous high-time resolution remote sensing images of the same type and same phenological crop;

[0040] Based on years of land use data, farmland planting is divided into grain planting area, miscellaneous grain planting area and vegetable planting area. Correspondingly, the crop types in the present invention are mainly divided into three types: grain, miscellaneous grains and vegetables.

[0041] The remote sensing image contains mu...


PUM


Abstract

The invention discloses a non-point source pollution source intensity estimation method based on crop information remote sensing accurate inversion, comprising steps: 1, obtaining continuous high-time resolution remote sensing images of the same type and the same phenological crop; 2, extracting EVI time series data of the remote sensing images , to obtain the phenological curve of the crop; to obtain the fertilization amount of different fertilization types at different fertilization nodes of the crop; 3, the ESTARFM time-spatial fusion of the remote sensing data with high spatial resolution and high temporal resolution, and extract the EVI time series data of the fused remote sensing image ; 4. According to the fused EVI time series data, the planting area of ​​different fertilization nodes of crops is obtained; 5. According to the amount of fertilizer applied and the planting area of ​​different fertilization nodes of crops, the intensity of non-point source pollution sources is estimated. The invention accurately extracts crop types through remote sensing images, determines the accumulation process of fertilization amount along with crop growth through crop phenological characteristics and fertilization information, and provides a more accurate estimation value for the strength of non-point source pollution sources.

Description

technical field [0001] The invention relates to the technical field of environmental protection, in particular to a non-point source pollution source intensity estimation method based on crop information remote sensing accurate inversion. Background technique [0002] Glossary: [0003] Non-point source pollution refers to water pollution caused by dissolved or solid substances flowing into receiving water bodies (rivers, lakes, etc.) under the action of large-scale rainfall and runoff erosion. The main sources include excessive use of pesticides and fertilizers, rural domestic sewage, etc. . [0004] Pollution source refers to the source of pollutants that cause environmental pollution, usually pointing to the place, equipment or human body that emits harmful substances in the environment or has a harmful impact on the environment. [0005] Pollution source intensity is mainly used to calculate the total amount of pollutants. [0006] Agricultural non-point source pollut...

Claims


Application Information

Patent Timeline
Patent Type & Authority Patents(China)
IPC IPC(8): G06K9/00G06T7/62G01N21/55
CPCG06T7/62G01N21/55G06T2207/30188G06T2207/10032G06V20/188
Inventor 吴太夏王树东
Owner HOHAI UNIV
Why Eureka
Try Eureka