

Method for recognizing light oil reservoir and gas condensate reservoir in stratum and application
A light oil layer technology, applied in the distribution characteristics of gas logging hydrocarbon components to identify light oil and condensate gas layers in the formation, and to identify light oil layers and condensate gas layers in the formation, it can solve the problem of reliability and The research or improvement of the effect cannot be said to be sufficient, etc., to achieve the effect of improving the interpretation rate, high reliability, and simple method
- Summary
- Abstract
- Description
- Claims
- Application Information
AI Technical Summary
Problems solved by technology
Method used
Image

Examples
no. 1 approach
[0073] In a first embodiment of the present invention, a method of identifying light oil layers and gas condensate layers in a formation is provided.
[0074] data collection
[0075] In the first embodiment, basic data collection is realized through gas logging. Step 1 is included in this embodiment, that is, obtaining a test well.
[0076] The "obtaining test wells" means that data sampling can be performed according to existing test wells, and of course, the "obtaining" also includes newly established test wells.
[0077] The present invention has no particular limitation on the specific method for establishing the test well. The establishment of test wells can be based on existing mature theories. At the same time, with the help of various instruments and equipment required, dynamic testing of downhole oil and gas is carried out for basic data collection. The basic principles or specific means of data collection are not particularly limited in the present invention, ...
no. 2 approach
[0114] In the second embodiment of the present invention, there is provided a use of the method according to in the interpretation and identification of oil and gas distribution of oil and gas reservoirs in the Xihu sag. Compared with the traditional method, the method of the present invention has a coincidence rate of 96.8% for gas logging interpretation of oil and gas layers in the geological structure of Xihu sag, which is about 10% higher than the traditional method for gas logging interpretation of oil and gas layers.
no. 3 approach
[0116] In a third embodiment of the present invention, a computer-readable storage medium is provided, on which a computer program or instruction is stored, and when the program or instruction is executed by a processor, the following steps are implemented:
[0117] Step 1, the collection of the measured value of gas composition, the measured value of described gas composition obtains based on the following method:
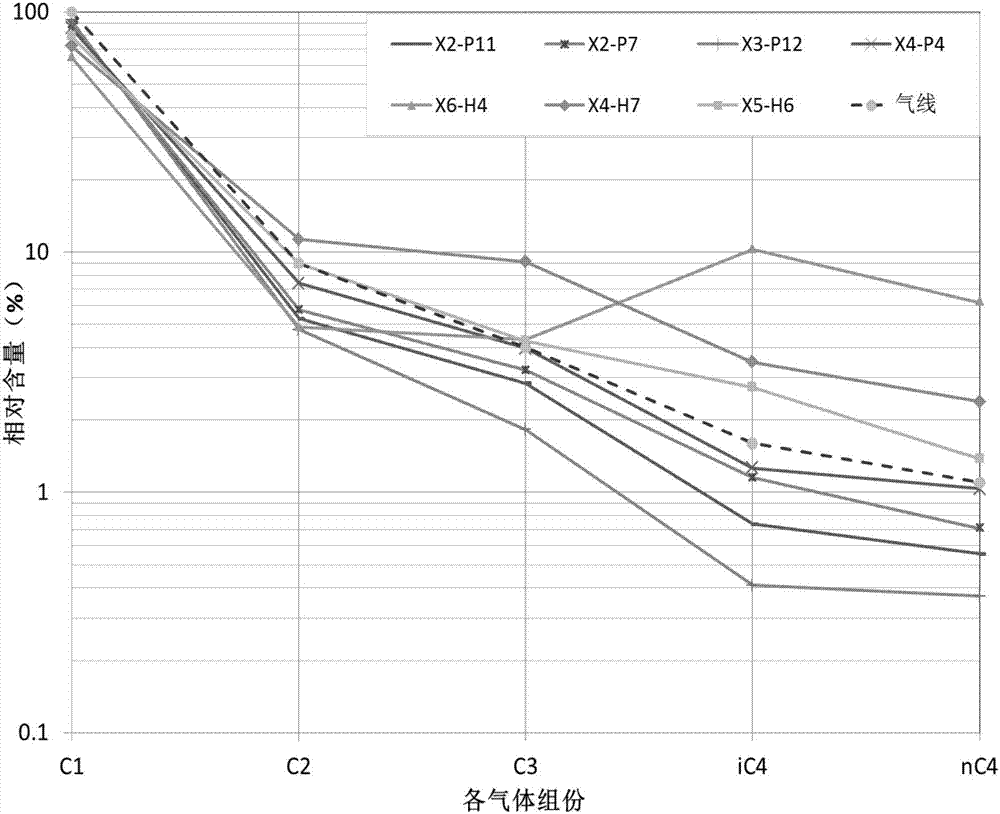
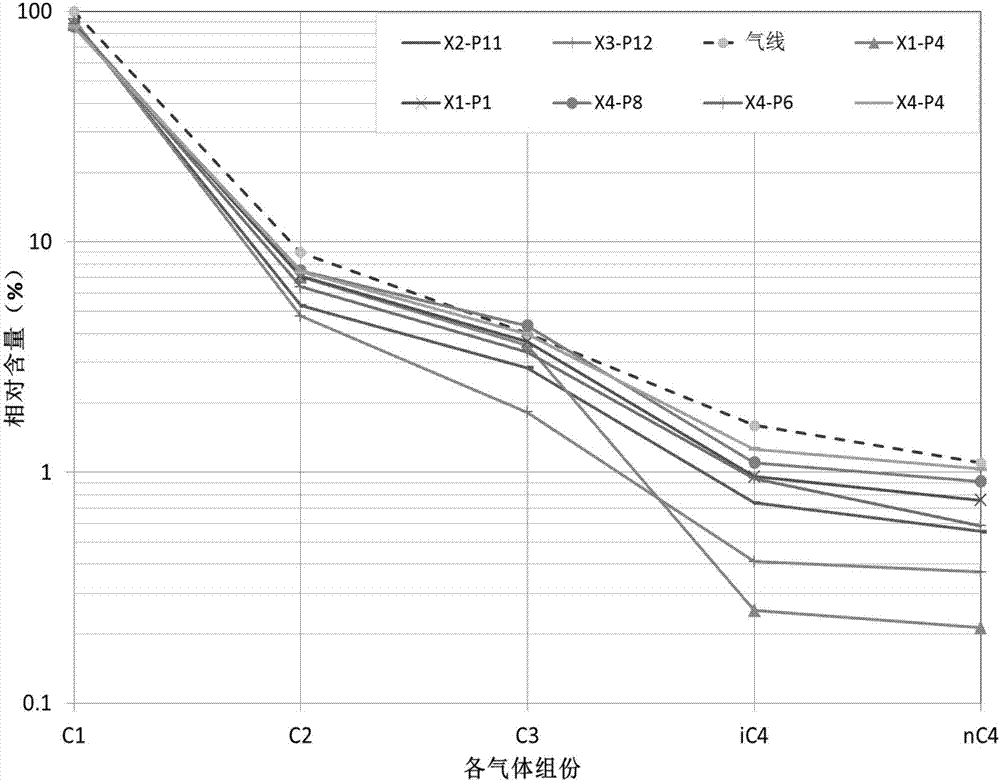
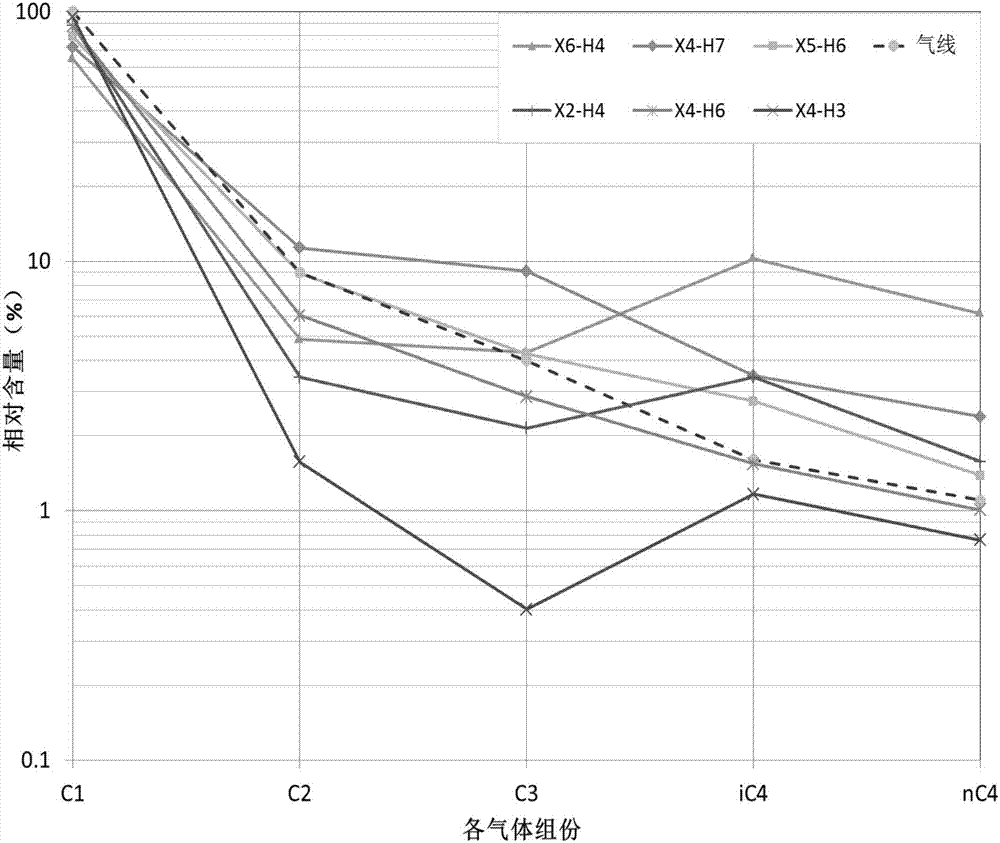
[0118] Obtain a test well, and measure the gas composition of layers at different depths in the test well, and the gas composition includes C in each layer. 1 、C 2 、C 3 , iC 4 and nC 4 , and optionally iC 5 and nC 5 The percentage of content, among them, C 1 Indicates a hydrocarbon with a carbon atom of 1, C 2 Indicates hydrocarbons with 2 carbon atoms, C 3 Indicates hydrocarbons with 3 carbon atoms, iC 4 Represents a hydrocarbon with a heterogeneous structure with 4 carbon atoms, nC 4 Represents a hydrocarbon with a normal structure of 4 carbon atoms, i...
PUM
 Abstract
Description
Claims
Application Information