Poor quality area analysis method, apparatus and system

A low-quality, regional technology, applied in the field of communications, can solve problems such as the inability to analyze network quality problems from a comprehensive perspective on large-scale network data, and achieve the effect of improving system capacity and processing efficiency.

Inactive Publication Date: 2018-01-05
ZTE CORP
View PDF0 Cites 14 Cited by
  • Summary
  • Abstract
  • Description
  • Claims
  • Application Information

AI Technical Summary

Problems solved by technology

[0005] The technical problem solved by the solution provided according to the embodiment of the present invention is that it is impossible to analyze the network quality problem from a comprehensive perspective for large-scale network data

Method used


Image

  • Poor quality area analysis method, apparatus and system
  • Poor quality area analysis method, apparatus and system
  • Poor quality area analysis method, apparatus and system

Examples


Embodiment Construction

[0045] The preferred embodiments of the present invention will be described in detail below in conjunction with the accompanying drawings. It should be understood that the preferred embodiments described below are only used to illustrate and explain the present invention, and are not intended to limit the present invention.

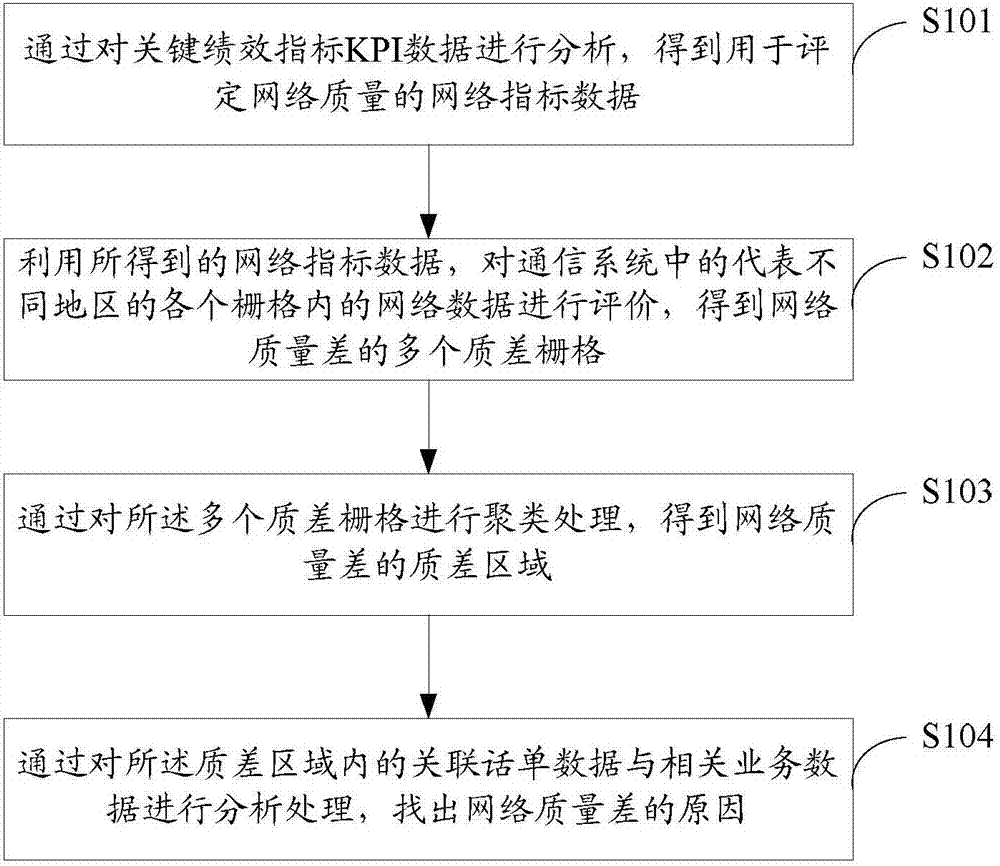
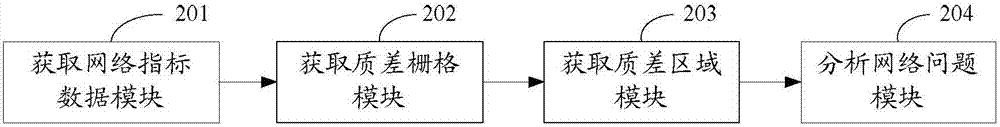
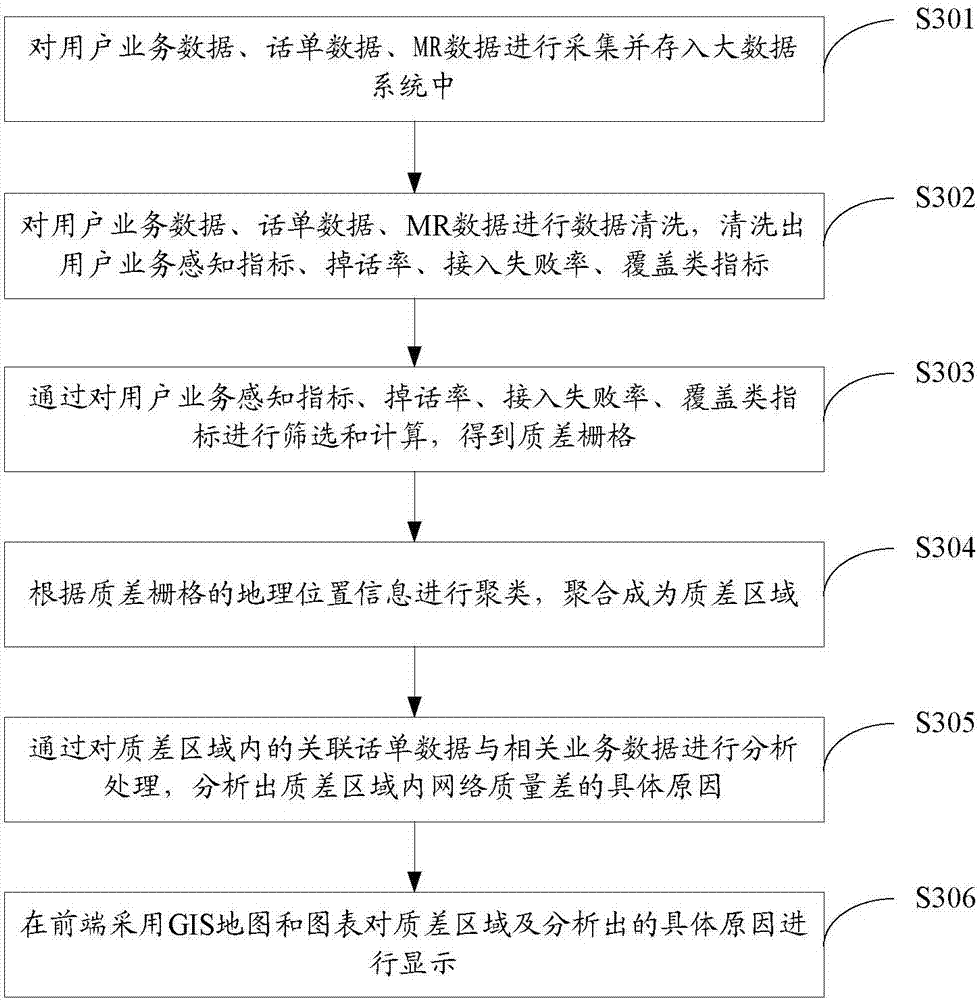
[0046] figure 1 It is a flow chart of a method for analyzing poor-quality regions provided by an embodiment of the present invention, such as figure 1 shown, including:

[0047] Step S101: Obtain network index data for evaluating network quality by analyzing KPI data;

[0048] Step S102: Using the obtained network index data, evaluate the network data in each grid representing different regions in the communication system, and obtain a plurality of poor quality grids with poor network quality;

[0049] Step S103: performing clustering processing on the plurality of poor-quality grids to obtain poor-quality areas with poor network quality;

[0050] Step...


PUM


Abstract

The invention discloses a poor quality area analysis method, apparatus and system, and relates to the technical field of communication. The method comprises the following steps: analyzing key performance indicator KPI data to obtain network indicator data used for evaluating network quality; evaluating network data within grids representing different areas in a communication system by using the obtained etwork indicator data to obtain a plurality of poor quality grids with poor network quality; performing clustering processing on the plurality of poor quality grids to obtain a poor quality area with poor network quality; and performing analysis processing on associated ticket data and related service data in the poor quality area to find the reason for the poor network quality. By adoptionof the poor quality area analysis method, apparatus and system provided by the invention, the system capacity is effectively improved, the processing efficiency of the system is improved, and the time is shortened.

Description

technical field [0001] The present invention relates to the field of communication technology, in particular to a method, device and system for analyzing poor-quality areas. Background technique [0002] With the rapid development of the mobile communication system, the scale of the communication system is getting bigger and bigger, and the structure is more and more complex. A new method is needed to analyze and optimize the network quality. [0003] In mobile communication systems, the evaluation of network quality will include many KPIs (Key Performance Indicators, key performance indicators), such as call drop rate, access failure rate, low rate, coverage indicators, etc., by analyzing the difference between corresponding indicators KPIs can analyze the specific reasons for poor network quality, and then optimize the network. [0004] Based on the above-mentioned characteristics of the mobile communication system, if the existing technical means are adopted, due to the ...

Claims


Application Information

Patent Timeline
Patent Type & Authority Applications(China)
IPC IPC(8): H04W24/02H04W24/08
CPCH04W24/02H04W24/08
Inventor 欧亮佳
Owner ZTE CORP
Why Eureka
Try Eureka