Temperature data display method and device and terminal

A data display and temperature technology, applied in the field of cloud computing, can solve problems such as poor user experience and inability to play information, and achieve the effect of improving user experience

Inactive Publication Date: 2018-02-02
ZHENGZHOU YUNHAI INFORMATION TECH CO LTD
View PDF4 Cites 9 Cited by
  • Summary
  • Abstract
  • Description
  • Claims
  • Application Information

AI Technical Summary

Problems solved by technology

However, users cannot intuitively obtain the temperature conditions in various regions through broadcast information on radio or TV, and the user experience is poor.

Method used


Image

  • Temperature data display method and device and terminal
  • Temperature data display method and device and terminal
  • Temperature data display method and device and terminal

Examples


Embodiment Construction

[0039] In order to enable those skilled in the art to better understand the technical solutions in the present application, the technical solutions in the embodiments of the present application will be clearly and completely described below in conjunction with the drawings in the embodiments of the present application. Obviously, the described The embodiments are only some of the embodiments of the present application, not all of them. Based on the embodiments in this application, all other embodiments obtained by persons of ordinary skill in the art without creative efforts shall fall within the scope of protection of this application.

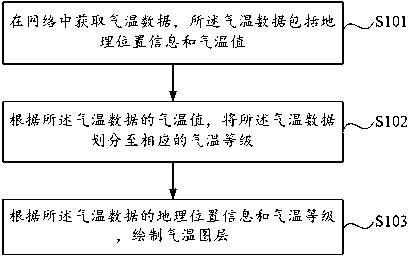
[0040] With the advent of the era of big data, we can analyze the big data (mainly meteorological data) in the network to determine the temperature in different regions and draw the temperature in different colors on the web interface. The depth of color and different colors can represent a level of temperature, allowing users to have an intu...


PUM


Abstract

An embodiment of the application discloses a temperature data display method and device and a terminal. The method comprises the following steps: temperature data is obtained in a network; the temperature data comprises geographic position information and temperature values; according to the temperature values in the temperature data, the temperature data is divided into corresponding temperaturegrades; according to the geographic position information in the temperature data and the temperature grades, a temperature image layer is drawn, areas corresponding to the same temperature grade on the temperature image layer are filled with the same color or the same gray value, and areas corresponding to different temperature grades can be filled with different colors or different gray values. Via adoption of the temperature data display method and device and the terminal disclosed in a technical solution provided in the embodiment of the application, the areas corresponding to different temperature grades can be filled with different colors based on meteorological data in the network, users are enabled to visually feel temperatures of different areas, and user experience can be improved.

Description

technical field [0001] The present application relates to the technical field of cloud computing, in particular to a temperature data display method, device and terminal. Background technique [0002] In meteorology, the physical quantity that expresses the degree of coldness and heat of air is called air temperature, or air temperature for short. The difference in temperature is one of the main factors that cause the difference between the natural landscape and our living environment, and it is very closely related to our life. [0003] Usually, people can know the temperature information of various regions through the weather forecast broadcast on radio or TV. However, users cannot intuitively obtain the temperature conditions in various regions through broadcast information on radio or television, and the user experience is poor. Therefore, how to intuitively display the temperature has become a technical problem to be solved urgently. Contents of the invention [00...

Claims


Application Information

Patent Timeline
Patent Type & Authority Applications(China)
IPC IPC(8): G01K1/02G01W1/00
CPCG01K1/02G01W1/00
Inventor 朱道昌
Owner ZHENGZHOU YUNHAI INFORMATION TECH CO LTD
Why Eureka
Try Eureka