

Method of using spectrograms and deep convolution neural network (CNN) to identify voice emotion
A technology of convolutional neural network and speech emotion recognition, which is applied in speech analysis, instruments, etc., can solve the problems of not enough convolution layers, too many, overfitting, etc., and achieve the effect of improving speech recognition ability
- Summary
- Abstract
- Description
- Claims
- Application Information
AI Technical Summary
Problems solved by technology
Method used
Image

Examples
Embodiment 1
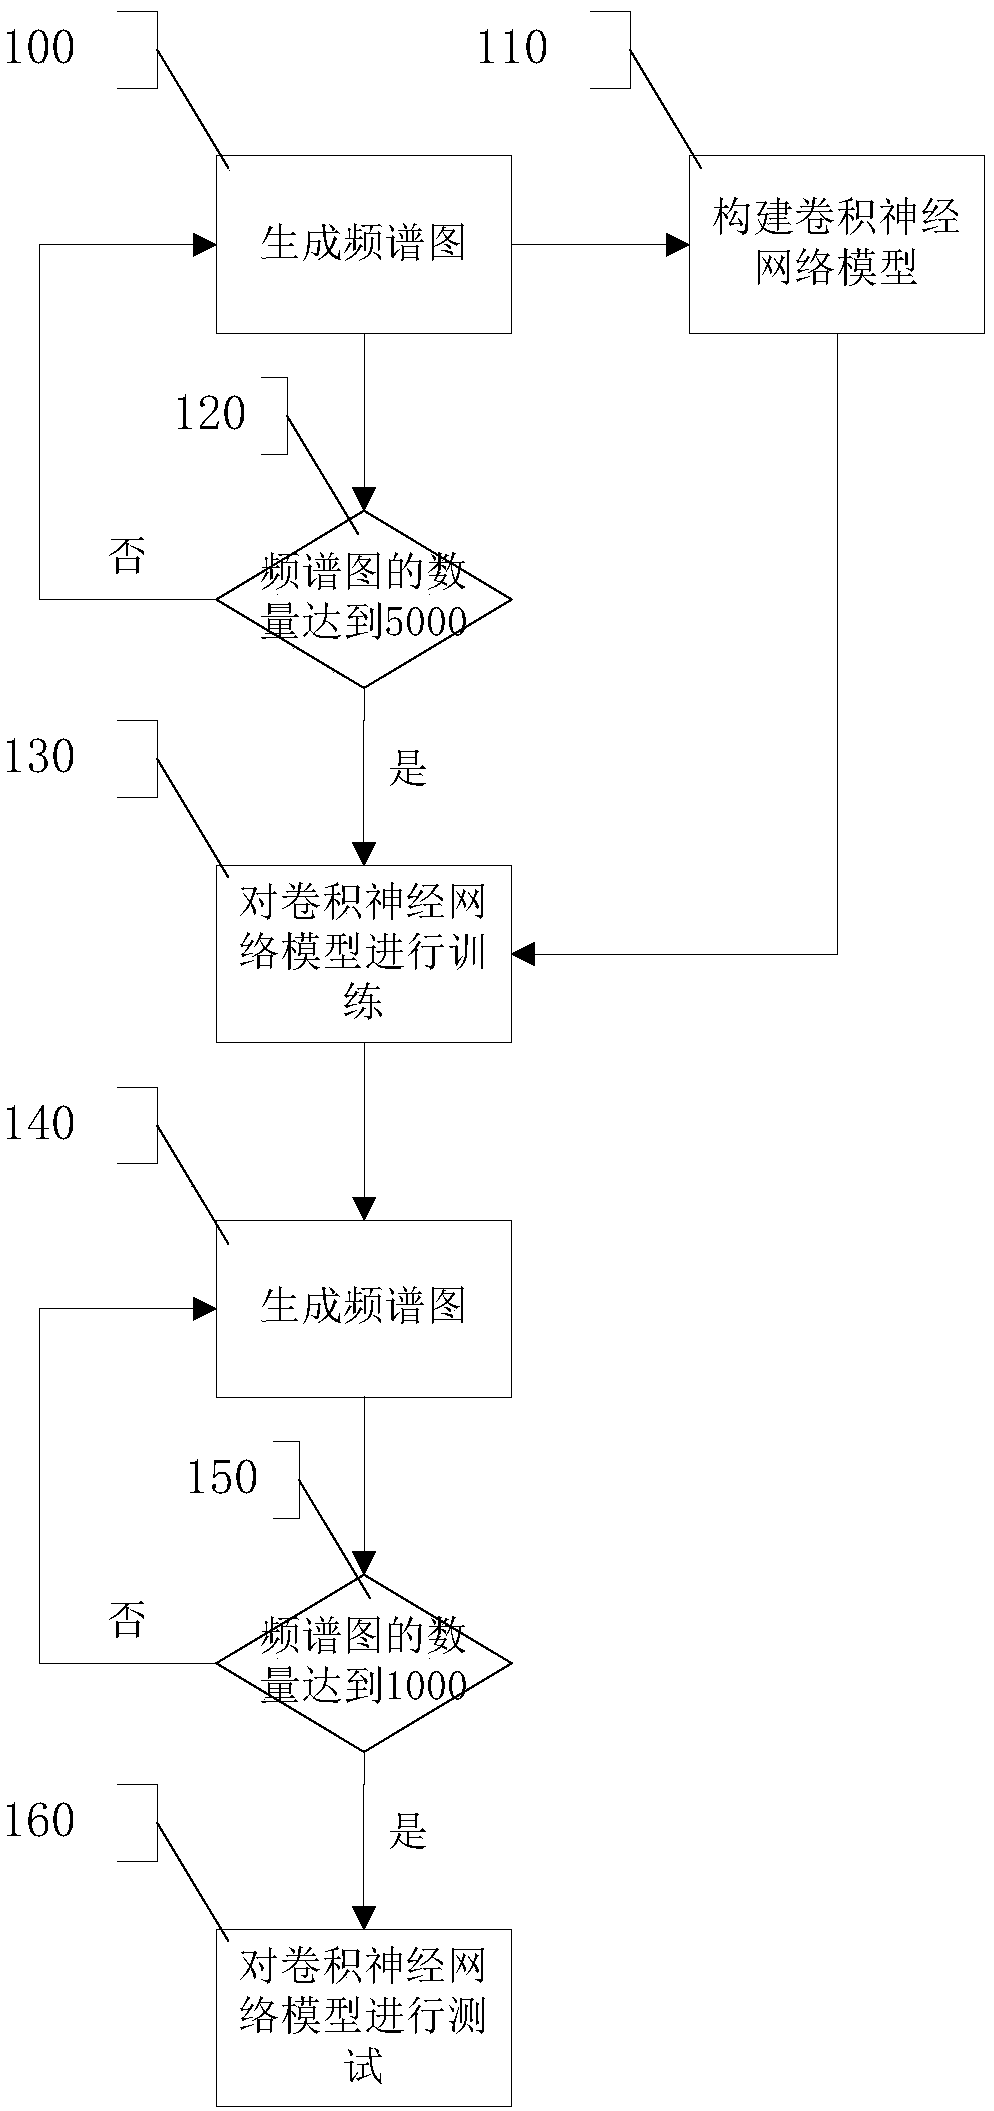
[0040] Such as figure 1 As shown, step 100 is executed to generate a spectrogram, and the spectrogram is generated according to the speech signal as the input data of the deep convolutional neural network model. The generation of the spectrogram specifically includes: the spectrogram is a visual representation of the frequency of a specific waveform of the speech signal changing with time. The spectrogram is a two-dimensional graph, the abscissa represents time, and the ordinate represents frequency. In the graph, the amplitude of the speech signal at a certain time and frequency portion is represented by the density and color of that point. Dark blue indicates low amplitude and bright red indicates high amplitude. The relationship between time and frequency is obtained by adding FFT conversion to the speech signal, that is, the spectrum diagram. In order to observe the frequency of the voice signal at a certain moment, the signal is divided into multiple blocks, and each b...
Embodiment 2
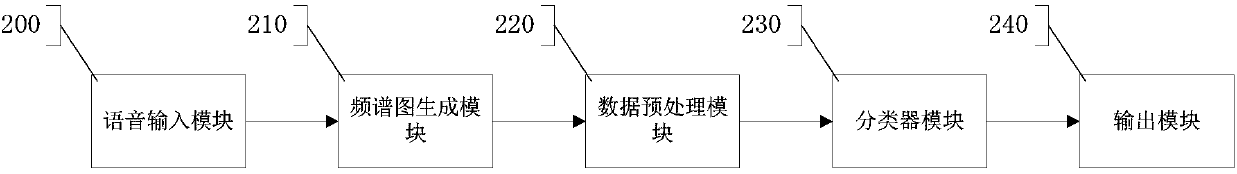
[0042] Such as figure 2 As shown, the overall system architecture of the present invention includes five parts: a speech input module 200 , a spectrogram generation module 210 , a data preprocessing module 220 , a classifier module 230 and an output module 240 .
[0043] The voice input module 200 is used for receiving input voice data.
[0044] The spectrogram generating module 210 is used to divide the input speech data to generate a spectrogram. The steps of its work are as follows: the signal is divided into multiple blocks, and each block is transformed by FFT. The Fourier change of a non-periodic continuous-time signal X(t) is defined as: What is calculated in the formula is the continuous frequency spectrum of the signal X(t). What is obtained in practical application is the discrete sampling value X(nT) of the continuous signal X(t). Therefore, it is necessary to use the discrete signal X(nT) to calculate the frequency spectrum of the signal X(t). DFT definition...
Embodiment 3
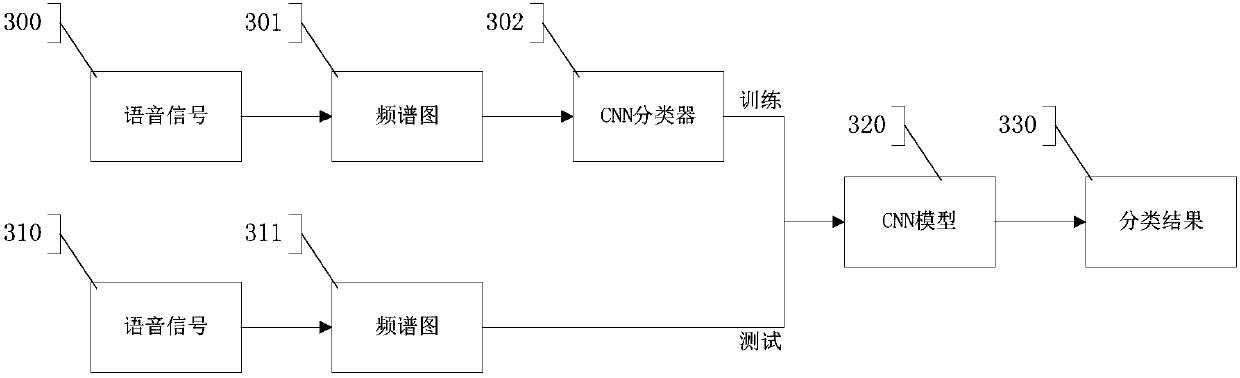
[0049] Such as image 3 As shown, the system is further explained from two parts of training and testing. Divide the voice signal 300 into a spectrogram 310, and the division method is as follows: Divide the signal into multiple blocks, and perform FFT transformation on each block. The Fourier change of a non-periodic continuous-time signal X(t) is defined as: What is calculated in the formula is the continuous frequency spectrum of the signal X(t). What is obtained in practical application is the discrete sampling value X(nT) of the continuous signal X(t). Therefore, it is necessary to use the discrete signal X(nT) to calculate the frequency spectrum of the signal X(t). DFT definition of finite length discrete signal X(n), n=0, 1,..., N-1 k=0, 1, . . . , N-1, Among them, N is the number of sampling points, and j represents the imaginary part of the negative number. Using the method above to generate 5,000 spectrograms, import them into the classifier 302 of the deep ...
PUM
 Abstract
Description
Claims
Application Information