Method and system for automatically realizing data visualization

A data and automatic technology, applied in the direction of visual data mining, structured data browsing, electronic digital data processing, etc., can solve the problems of complex programming, low flexibility of business tools, and low automation of visual flow chart construction tools

Active Publication Date: 2018-03-06
PEKING UNIV
View PDF7 Cites 20 Cited by
  • Summary
  • Abstract
  • Description
  • Claims
  • Application Information

AI Technical Summary

Problems solved by technology

[0003] Therefore, in the existing rapid construction and exploration and analysis work for information visualization, the programming is complicated, the flexibility of commercial tools is not high, and a lot of manual exploration is requir...

Method used


Image

  • Method and system for automatically realizing data visualization
  • Method and system for automatically realizing data visualization
  • Method and system for automatically realizing data visualization

Examples


Embodiment Construction

[0062] The present invention will be further described in detail below in conjunction with the accompanying drawings and specific embodiments.

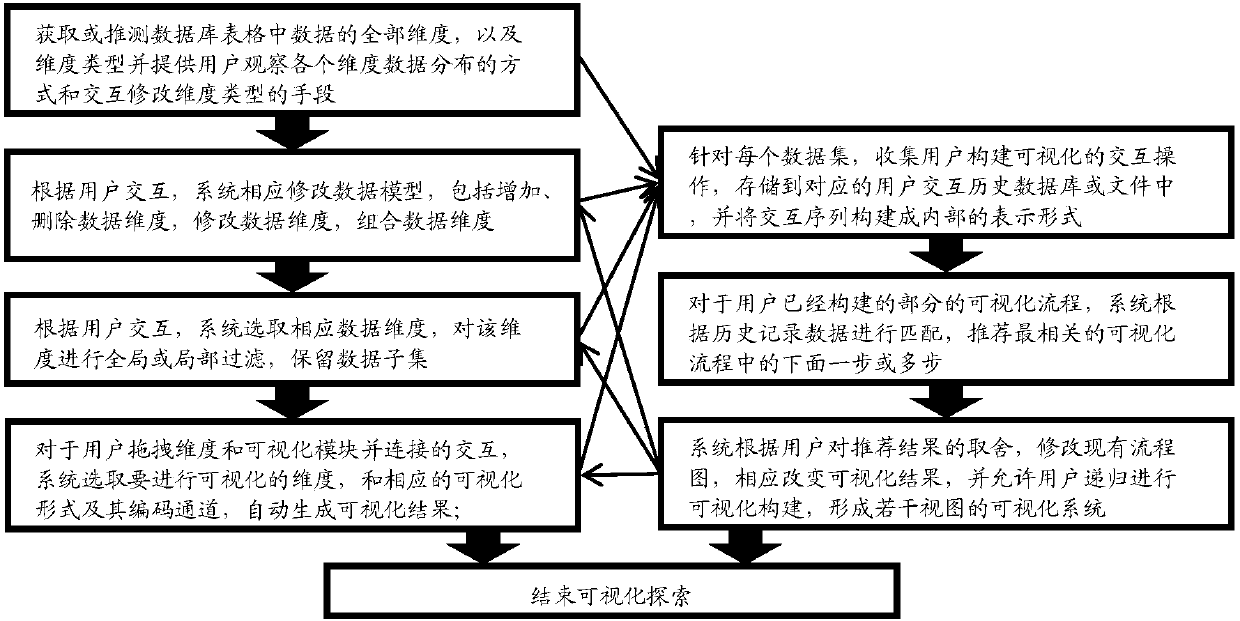
[0063] A method for automatically implementing data visualization analysis includes the following steps:

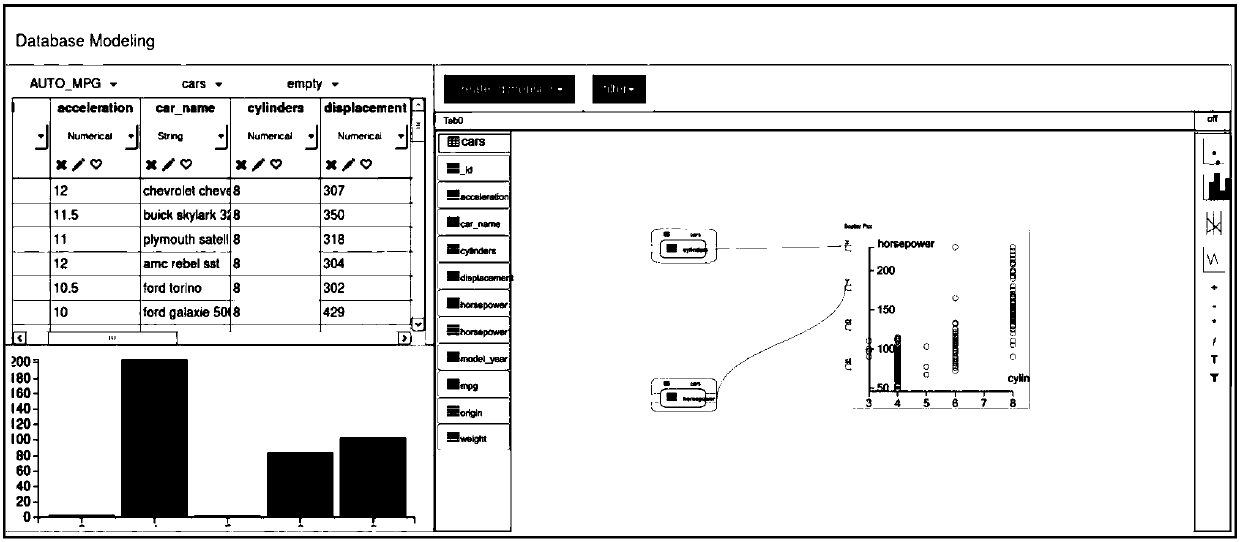
[0064] The user first selects the database and table to be explored, observes the distribution of each dimension, and determines the changes to the data model, including adding, deleting, modifying dimensions, etc., to form a new data model;

[0065] Then perform global or local filtering on a certain dimension or combination of data to obtain a subset of data;

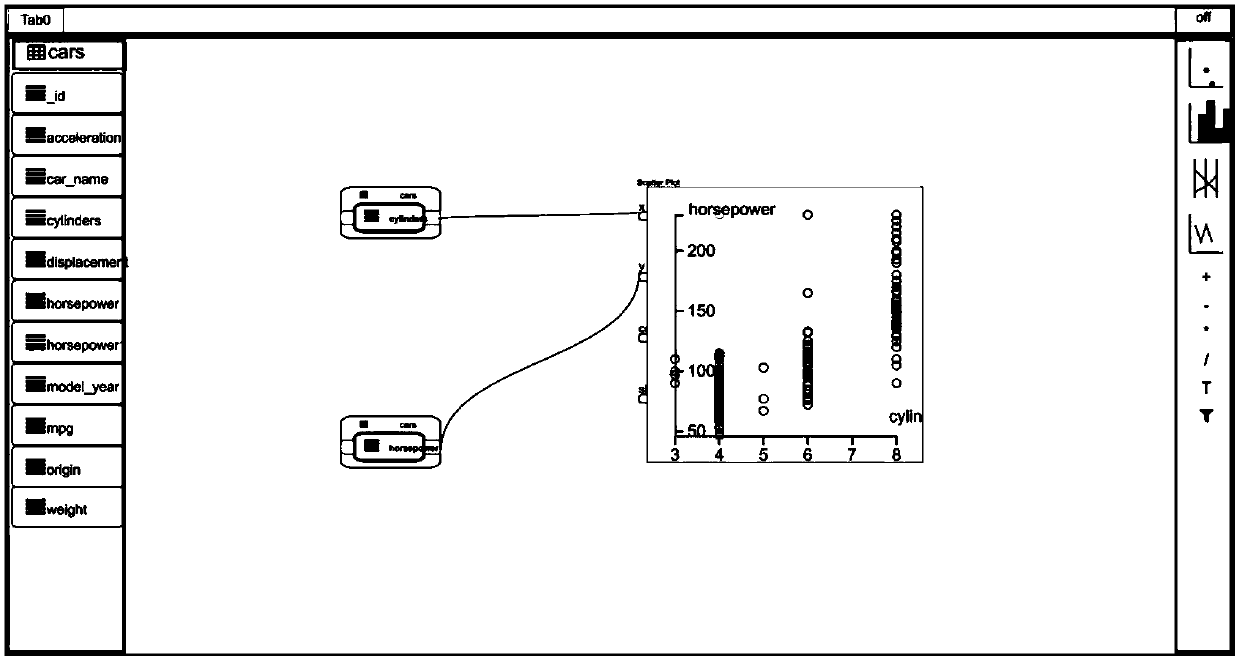
[0066] Then, the user selects the dimension or combination that he wants to visualize, connects them with the visualization module, and obtains the corresponding visualization result;

[0067] In each of the above steps, the system collects the user's interaction sequence and stores it in the user interaction history database. During each step of the user's interaction ...


PUM


Abstract

The invention relates to a method and a system for automatically realizing data visualization, and belongs to the field of visualization and visual analysis. The method comprises the following steps that: a user firstly selects a database and a form which carry out searching, observes the distribution situation of each dimension and determines the change of a data model to form a new data model, wherein the change of the data model comprises the increase, the deletion and the revision of the dimension; then, the certain dimension or the dimension combination of the data is globally or partially filtered to obtain a data subset; and the user selects the dimension or the dimension combination which needs to be visualized, and connects the dimension or the dimension combination with a visualization module to obtain a corresponding visualization result. In the above steps, the system collects the interaction sequence of the user, stores the interaction sequence into a user interaction historical database, carries out matching according to interaction history and recommends a possible visualization construction process. By use of the method, a tool capable of supporting the user to construct a visual integral process can be provided, and the method has the advantages of high flexibility and high automation degree.

Description

technical field [0001] The invention belongs to the field of visualization and visual analysis starting from a database, and in particular relates to a method and system for automatically realizing data visualization that automatically recommends data modeling and visualization forms according to an existing database. Background technique [0002] The development of database technology and the emergence of data make the data stored in the database more and more abundant, thus increasing the demand for exploring and analyzing data. Visualization methods are suitable for exploratory analysis of data in databases, allowing users to understand the overall picture of the data and possible interesting patterns. However, visually exploring the data in the database requires users to perform corresponding data conversion and visual programming, which raises the threshold and increases the workload. Even using commercial tools for exploratory analysis requires users to have certain v...

Claims


Application Information

Patent Timeline
IPC IPC(8): G06F17/30
CPCG06F16/26
Inventor 袁晓如蒋瑞珂
Owner PEKING UNIV
Why Eureka
Try Eureka