Medium- and long-term air pollution forecast model combining with large-scale weather system index
An air pollution and forecasting model technology, which is applied in weather forecasting, meteorology, measuring devices, etc., can solve problems such as difficulties in air pollution forecasting, and achieve the effects of clear forecast results, easy promotion, and easy forecasting process.
- Summary
- Abstract
- Description
- Claims
- Application Information
AI Technical Summary
Problems solved by technology
Method used
Image
Examples
Embodiment 1
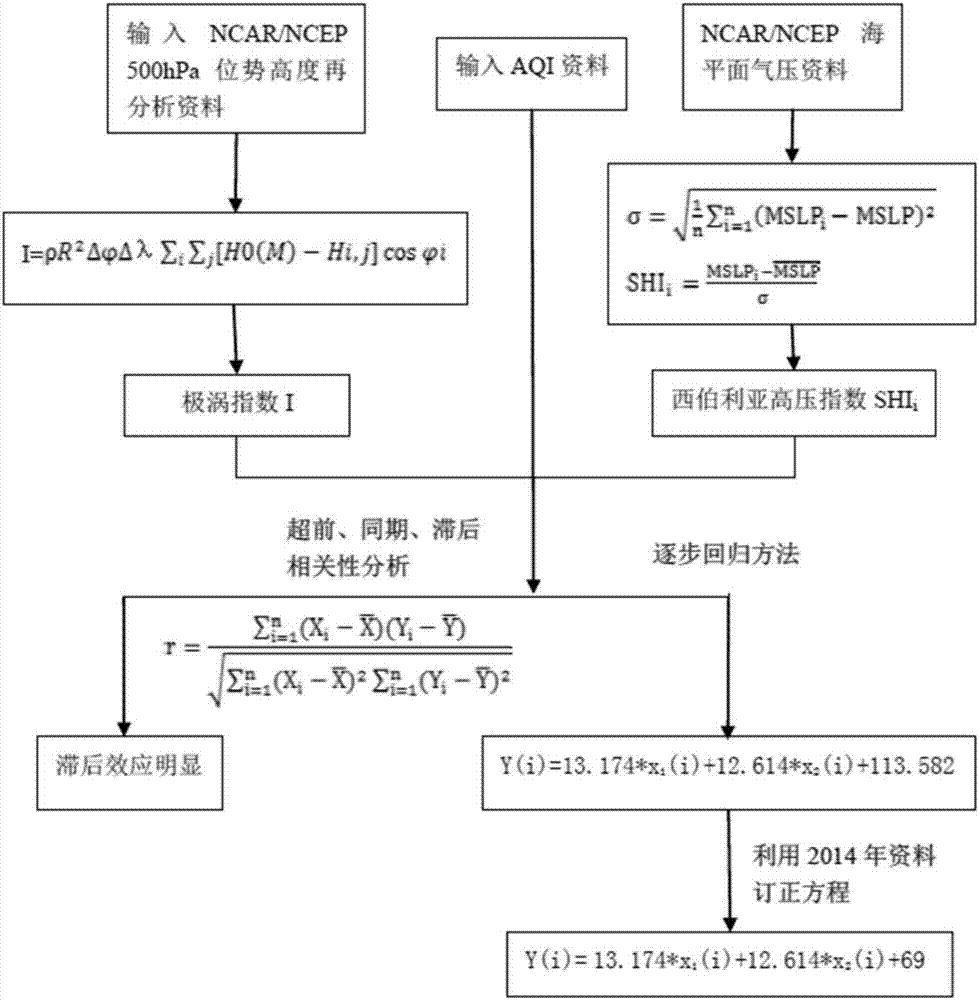
[0016] A kind of medium and long-term air pollution forecasting model of the present invention combined with large-scale weather system index, at first utilize the conventional meteorological data that observation obtains and the data that NCEP (National Meteorological Center of the United States), NCAR (National Center for Atmospheric Research of the United States) provide, according to relevant formula Algorithm to calculate polar vortex index and Siberian high index by Fortran programming.
[0017] Secondly, through the SPSS (statistical correlation software can find the correlation between data) software, the correlation between the Air Quality Index (AirQualityIndex) AQI and the calculated polar vortex index and Siberia index in the same time period is established by stepwise regression method, The length of the data is 14 years from 2000 to 2013. Using leading, contemporaneous and lagging correlation analysis, it is found that among the large-scale weather systems that a...
Embodiment 2
[0021] The polar vortex index and Siberian high pressure index from December 3rd to 17th, 2014 were calculated by using the geopotential height field data and sea level pressure field data, and brought into the forecast equation:
[0022] y(i)=13.174×X 1 (i)+12.614×X 2 (i)+69
[0023] The AQI value of this time period is obtained, and the comparison with the observed real value is shown in the following table:
[0024] Table 1. Comparison of the predicted AQI and the actual value obtained by using the equation
[0025] Calculated
81
85
105
92
100
91
85
91
95
97
100
91
90
104
97
actual value
70
105
158
92
113
120
67
106
95
95
125
138
94
94
89
[0026] As shown in Table 1, the error range between the calculated value and the real value is about 20, and the classification accuracy rate reaches 73%. Except for the incorrect calculation of individual data, other data a...
PUM
 Abstract
Description
Claims
Application Information
 - R&D
- Intellectual Property
- Life Sciences
- Materials
- Tech Scout
- Unparalleled Data Quality
- Higher Quality Content
- 60% Fewer Hallucinations
Browse by: Latest US Patents, China's latest patents, Technical Efficacy Thesaurus, Application Domain, Technology Topic, Popular Technical Reports.
© 2025 PatSnap. All rights reserved.Legal|Privacy policy|Modern Slavery Act Transparency Statement|Sitemap|About US| Contact US: help@patsnap.com

