A Multi-modal Traffic Demand Impact Analysis Method Based on Space Vector Autoregressive Model

An autoregressive model, a technology of traffic demand, applied in the direction of road vehicle traffic control system, traffic flow detection, traffic control system, etc., can solve the problem of inability to consider correlation, time-varying spatial characteristics, etc., and achieve the effect of quantifying the spatial spillover effect

Active Publication Date: 2019-07-26
BEIHANG UNIV
View PDF5 Cites 0 Cited by
  • Summary
  • Abstract
  • Description
  • Claims
  • Application Information

AI Technical Summary

Problems solved by technology

However, for regional multi-modal traffic demand, most scholars in the past only conducted isolated research, and traditional models and methods were unable to consider the correlation, time-varying, and complex impact relationships with spatial characteristics between two or more variables.

Method used


Image

  • A Multi-modal Traffic Demand Impact Analysis Method Based on Space Vector Autoregressive Model
  • A Multi-modal Traffic Demand Impact Analysis Method Based on Space Vector Autoregressive Model
  • A Multi-modal Traffic Demand Impact Analysis Method Based on Space Vector Autoregressive Model

Examples


Embodiment

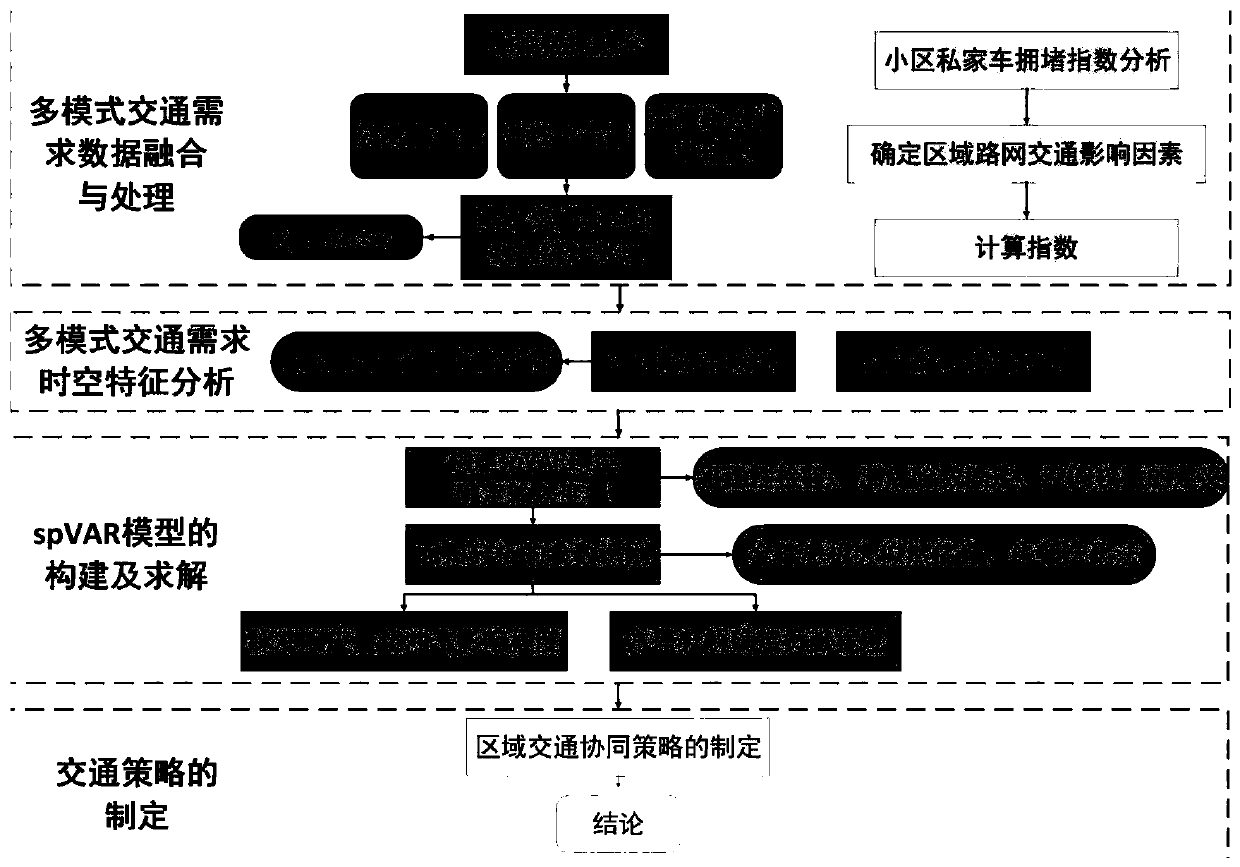
[0088] A multi-modal traffic demand impact analysis method based on a spatial autoregressive model is as follows:

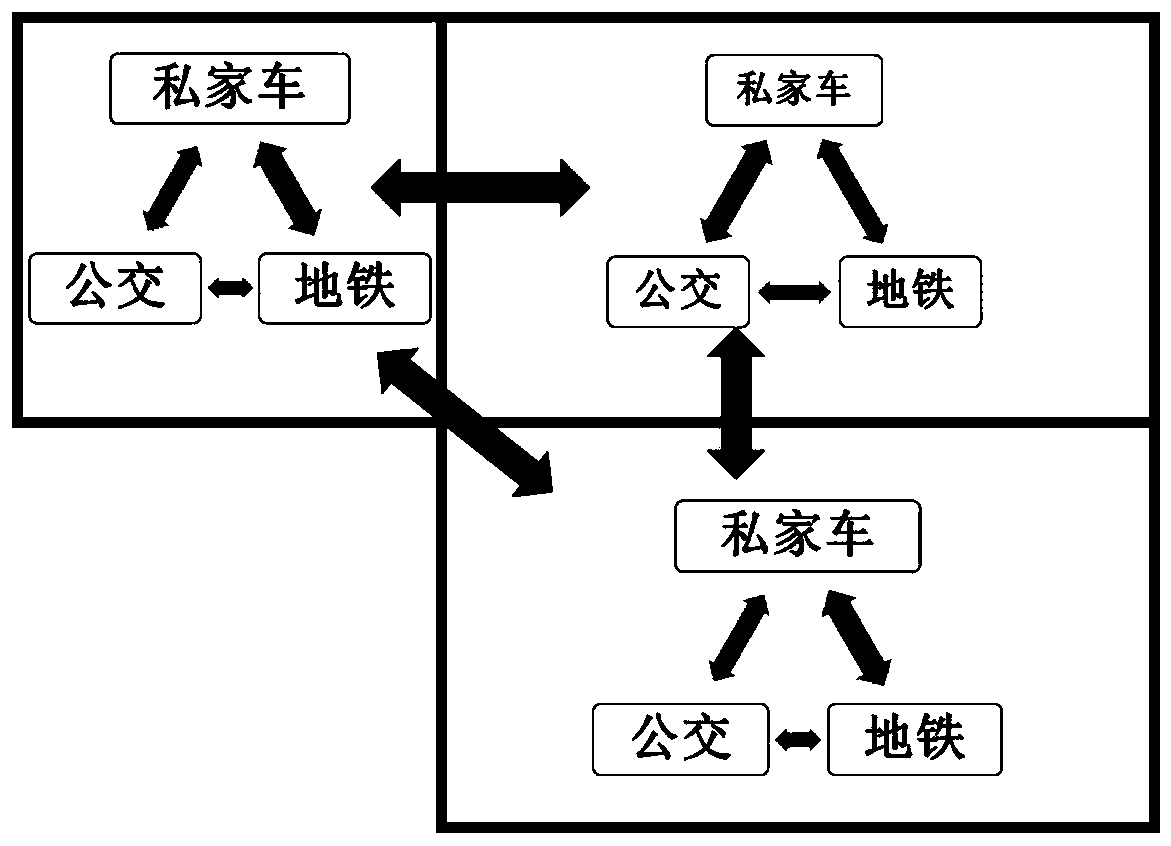
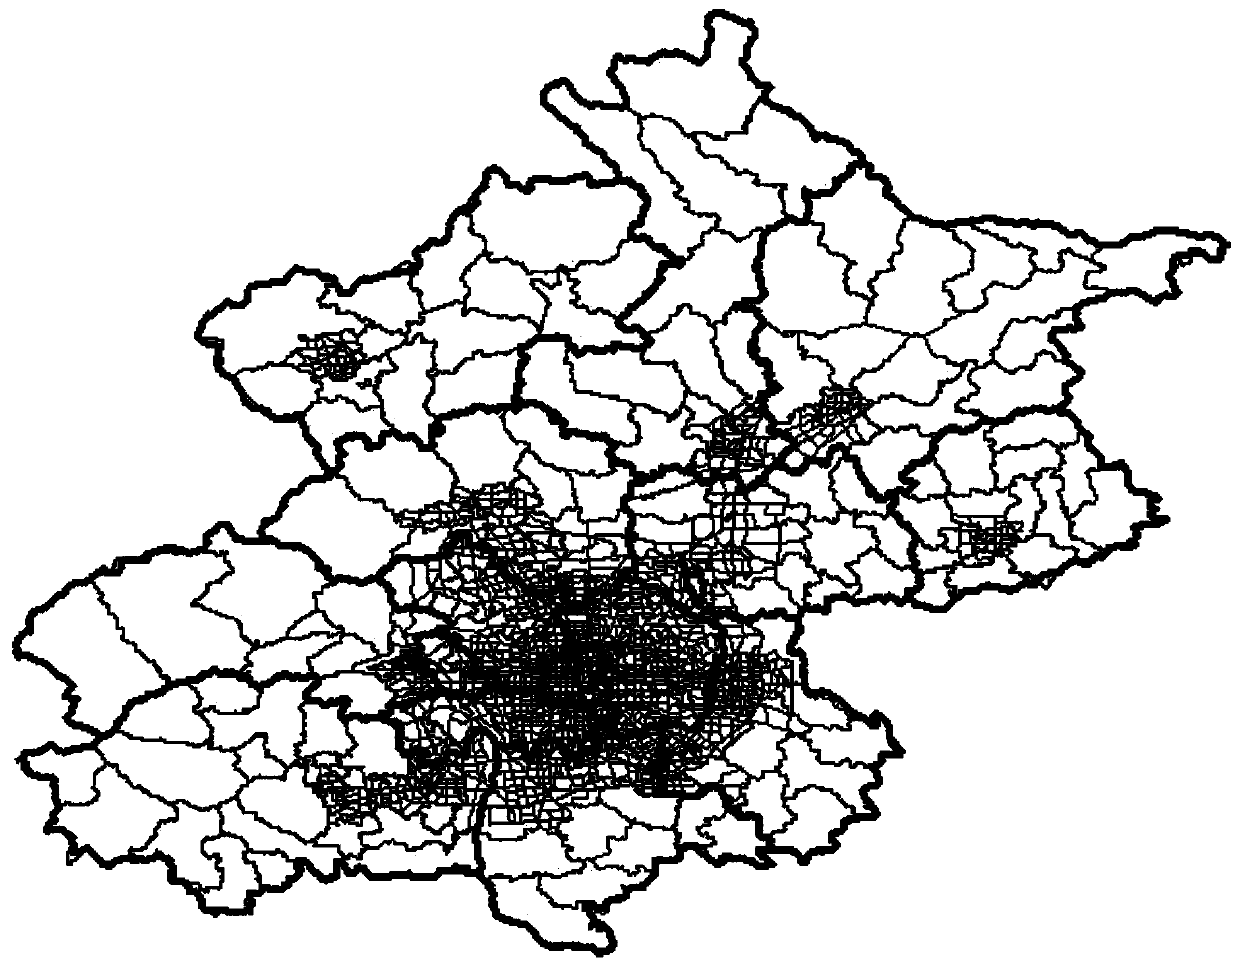
[0089] 1), if Figure 4 As shown in the figure, for the two traffic communities near Xidan and Fuxingmen in Beijing, the number of subway stops, the number of buses boarding, and the road network congestion index of the selected traffic communities are calculated respectively. The results are shown as follows:

[0090] Table taz1 community subway, bus, road network data

[0091]

[0092] Table taz2 community subway, bus, road network data

[0093]

[0094]

[0095] 2), the stationarity test of the variables. The demand for three modes of transportation in two communities—the number of subway stops, the number of bus rides, and the private car congestion index—a total of six variables are used as the input variables of the model. The unit root test is performed on the six variables of the original data to quantitatively analyze the variable stationari...


PUM


Abstract

The invention provides a multi-mode traffic demand influence analysis method, for different areas of public traffic demands and private cars, based on a spatial vector autoregression model. The methodmainly comprises that (1) a multi-mode traffic demand cooperation model among the areas is established, a traditional spVAR model is improved, a regional POI index is introduced to define the spatialweight for the areas of different traffic modes, and a multi-mode traffic demand spatial VAR model including the regional space structural relation is constructed; and (2) a multi-mode traffic demandcooperation strategy of different areas is provided. Pulse response and variance decomposition results of different traffic modes are solved on the basis of the constructed regional multi-mode traffic spatial VAR model, further, a spatial overflow effect of the traffic demands is obtained by analysis, and the cooperative strategy model for different spatial states and traffic states is provided and constructed. It is proved that the model can improve the availability and scientific performance of traffic efficiency.

Description

technical field [0001] The invention belongs to the technical field of intelligent traffic information processing, in particular to a multi-mode traffic demand impact analysis method based on a space vector autoregression model. Background technique [0002] With the increasing scale of contemporary cities and the improvement of the level of urban motorization, urban transportation has developed rapidly, and the internal structure of the transportation system has gradually increased in complexity. Taking Beijing as an example, as of 2016, the number of private cars reached 5.44 million, the average daily passenger volume of public transport reached 13.56 million, and the average daily passenger flow of subway reached 9.998 million. Modal transportation has increasingly become the mainstream of urban transportation system. [0003] Because the traffic flow spreads along the road network and is closely related to the geographical structure, the traffic has certain spatial cha...

Claims


Application Information

Patent Timeline
Patent Type & Authority Patents(China)
IPC IPC(8): G08G1/01G06Q10/06G06Q50/30
CPCG06Q10/06315G06Q50/30G08G1/0129
Inventor 马晓磊张宪杜博文于海洋丁川
Owner BEIHANG UNIV
Why Eureka
Try Eureka