A Raman spectrum signal-to-noise ratio evaluation method

A technology of Raman spectroscopy and signal-to-noise ratio, applied in the field of CCD spectrometer, can solve problems such as poor applicability

Active Publication Date: 2020-08-21
南京简智仪器设备有限公司
View PDF4 Cites 0 Cited by
  • Summary
  • Abstract
  • Description
  • Claims
  • Application Information

AI Technical Summary

Problems solved by technology

The type of noise changes, which leads to the deterioration of the applicability of the original spectral quality evaluation method.

Method used


Image

  • A Raman spectrum signal-to-noise ratio evaluation method
  • A Raman spectrum signal-to-noise ratio evaluation method
  • A Raman spectrum signal-to-noise ratio evaluation method

Examples


Embodiment Construction

[0023] A Raman spectrum signal-to-noise ratio evaluation method, comprising the steps of:

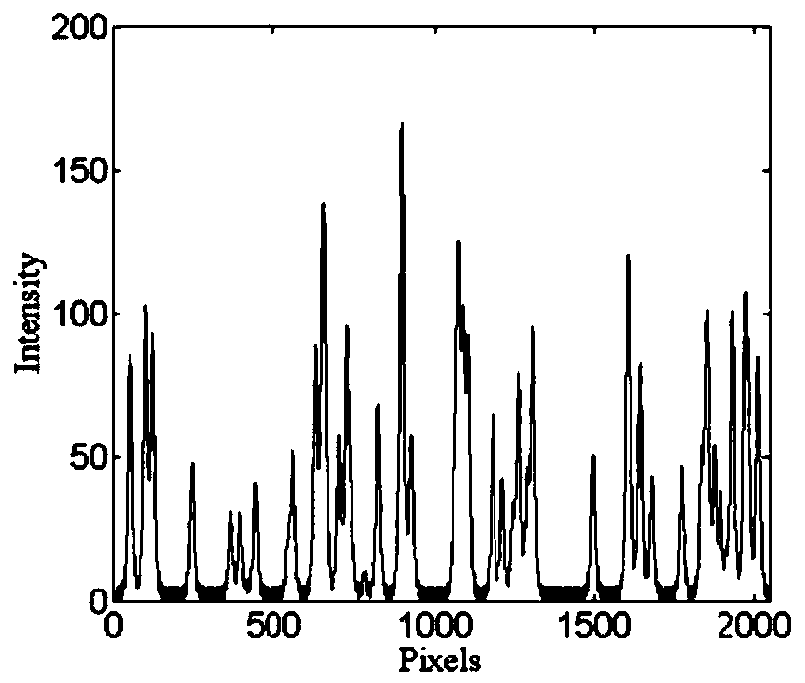
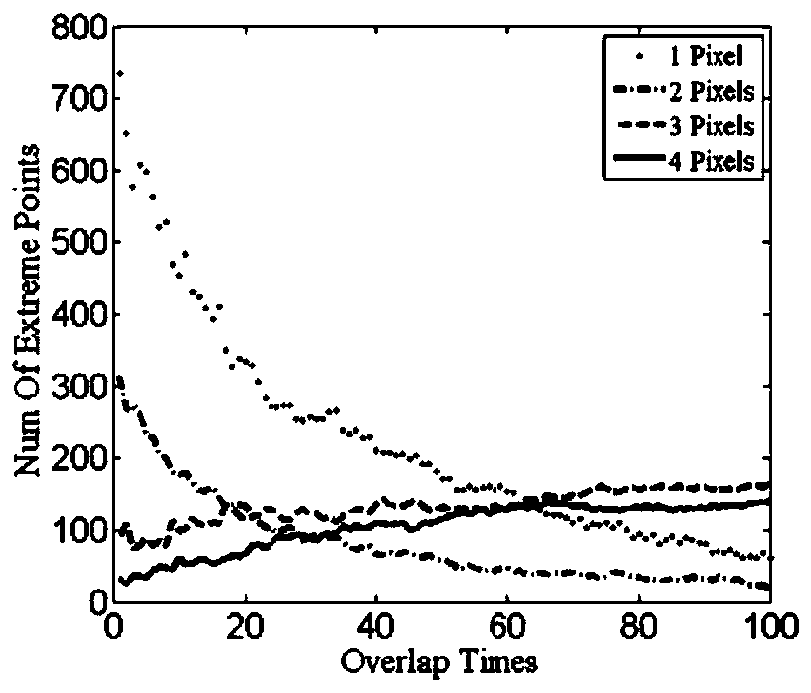
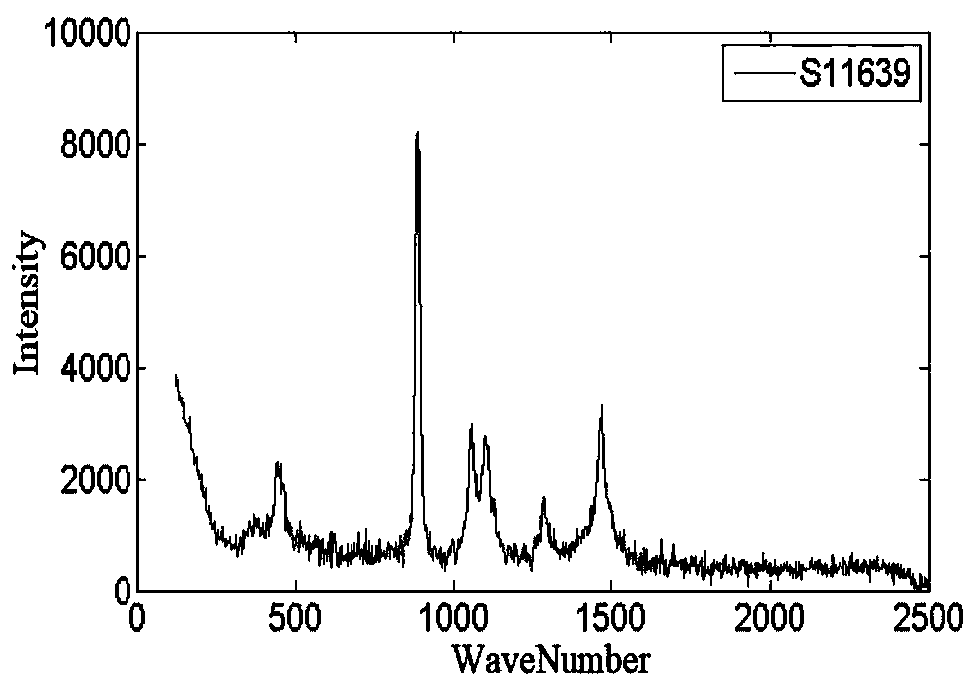
[0024] (1) CCD spectrometer spectrogram extreme point spacing statistics; use the same standard sample, fixed integration time, collect Raman spectra multiple times, and classify and count the spectra with different superimposed average times according to the extreme point spacing in the spectrogram ;

[0025] (2) Determine the CCD dark current noise; according to the statistical results of classification in (1), determine the pixel spacing threshold, and use the average value of the extreme difference between adjacent extreme points with short spacing and classification counts that do not increase with the average number of spectrogram superimpositions as Noise, corresponding to the average power per unit time of the dark noise of the Raman spectrometer;

[0026] (3) Signal-to-noise ratio calculation; the signal-to-noise ratio of the CCD spectrometer is defined as: SNR=S / Noise, wherei...


PUM


Abstract

The invention discloses a Raman spectrum signal-to-noise ratio evaluation method which comprises the following steps: (1) counting intervals of extreme values of spectrums of a CCD (Charge Coupled Device) spectrograph; (2) confirming CCD dark current noise; (3) calculating a signal-to-noise ratio. The invention discloses a simple, convenient and feasible signal-to-noise ratio evaluation method, the signal-to-noise ratio acquired by an equipment Raman spectrum can be estimated according to single spectrums, theories and experiments show that for a Raman spectrograph based on a CCD detector, when a sample and a characteristic peak are confirmed, a signal-to-noise ratio can be acquired on the basis of the method, Raman spectrum equipment of different configurations can be compared, and as a standard for controlling consistence of spectrum quality, the method has instruction significances for development of intelligent identification systems based on Raman spectrum techniques.

Description

technical field [0001] The invention relates to the technical field of CCD spectrometers, in particular to a fast and effective Raman spectrum signal-to-noise ratio evaluation method. Background technique [0002] In recent years, the rapid development of CCD spectrometer modules has promoted the development of portable spectrometers, and the portable Raman spectrometer based on CCD spectrometers is not only used in scientific research, but also in military and civilian fields due to its rapidity and non-destructiveness to samples. areas are outstanding. For spectral analysis, stable and accurate evaluation of spectral quality is very important, and Raman spectral signal-to-noise ratio determines whether the characteristic signal of the measured sample itself can be effectively extracted from background interference, and is an important parameter for equipment comparison. [0003] The traditional spectral detector is based on the moving grating principle and the single-poin...

Claims


Application Information

Patent Timeline
IPC IPC(8): G01N21/65
CPCG01N21/65
Inventor 刘峰刘恩凯王梓儒殷磊蔡圣闻
Owner 南京简智仪器设备有限公司
Why Eureka
Try Eureka