Method and device for processing visual chart information

A processing method and technology of a processing device, applied in the Internet field, can solve the problems of reducing reading experience, unreasonable data information processing methods, etc., to achieve the effect of enhancing reading experience and avoiding misoperation

Active Publication Date: 2022-05-17
ALIBABA GRP HLDG LTD
View PDF9 Cites 0 Cited by
  • Summary
  • Abstract
  • Description
  • Claims
  • Application Information

AI Technical Summary

Problems solved by technology

Here we take the pie chart as an example. When there are too many indicators used to classify and distinguish data information, if the normal display method is used, the data information corresponding to each indicator will be densely displayed on the pie chart. Figure four week, such as figure 1 As shown, this unreasonable data information processing method undoubtedly reduces the reading experience
[0003] On the other hand, when the proportion of data information corresponding to each indicator is uneven, it is possible that most of the data information corresponding to small proportion indicators will be piled up together, which also reduces the reading experience.

Method used


Image

  • Method and device for processing visual chart information
  • Method and device for processing visual chart information
  • Method and device for processing visual chart information

Examples


Embodiment Construction

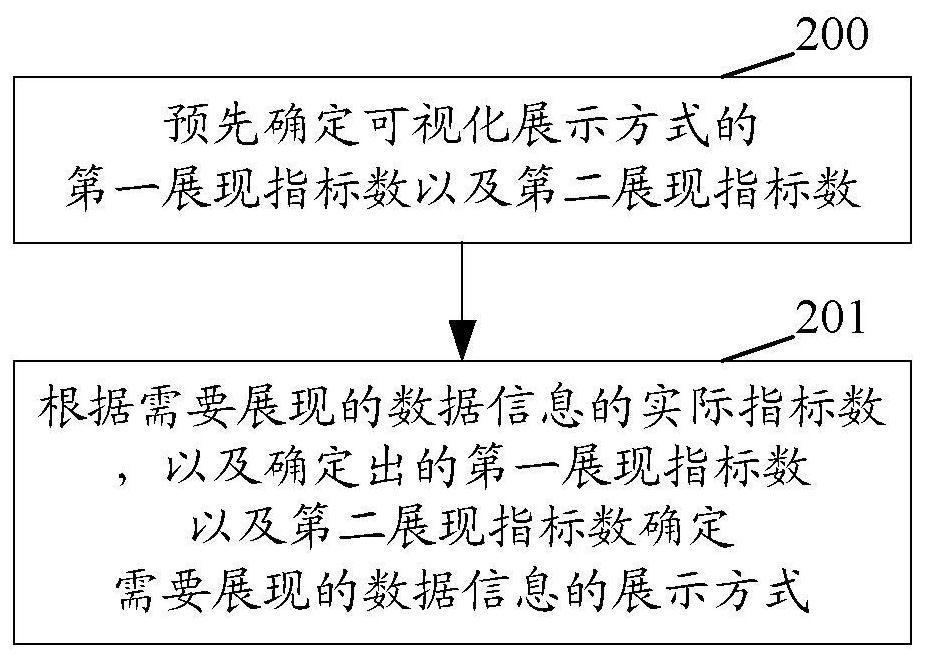
[0036] In order to make the purpose, technical solution and advantages of the application clearer, the embodiments of the application will be described in detail below in conjunction with the accompanying drawings. It should be noted that, in the case of no conflict, the embodiments in the present application and the features in the embodiments can be combined arbitrarily with each other.

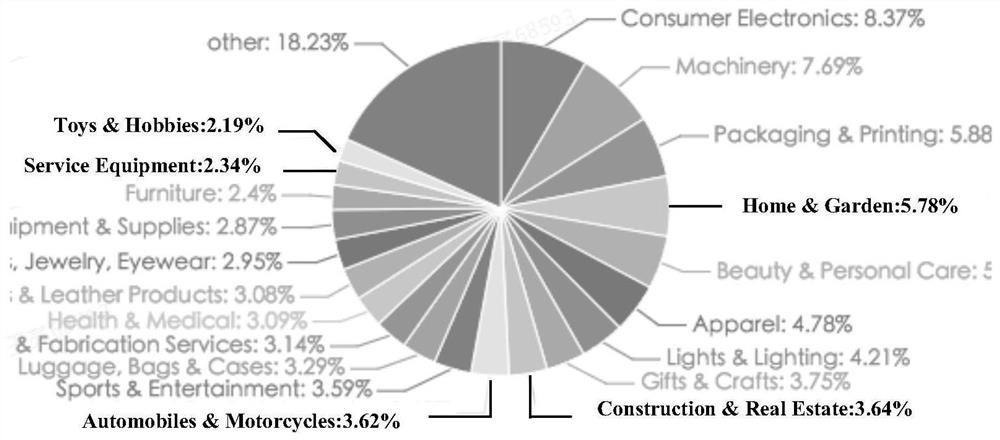
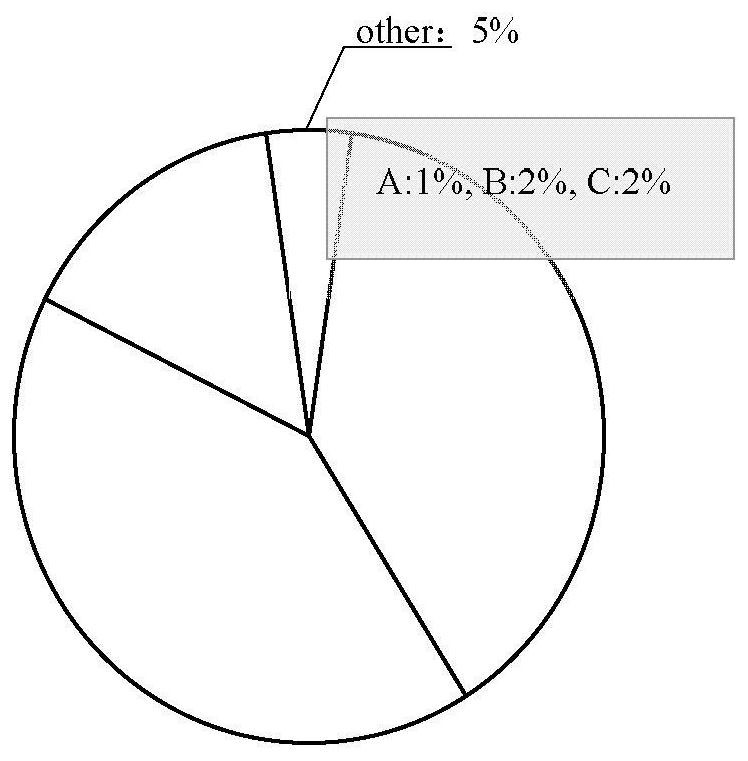
[0037] In related technologies, in order to avoid data information being densely displayed in a visual way such as pie Figure four Weekly, the data information corresponding to some qualitative changes is presented in the form of other parts of a whole. For example, if the number of indicators is M, the data information corresponding to the first (N-1) (TOPN-1) indicators will be displayed in the normal way of pie chart, and the proportion of data information corresponding to the Nth to Mth indicators Merged into the Nth pie and displayed in the form of other. This way can be called as TO...


PUM


Abstract

The present application discloses a method and device for processing visual chart information. According to the characteristics of the visualization method, the present application sets and passes the setting of two display index thresholds, that is, the first display index number and the second display index number. The data information that needs to be displayed is well analyzed, and the appropriate display method is adopted in a targeted manner, which realizes the reasonable processing of the data information and enhances the reading experience of the display graph. Furthermore, through reasonable setting of the proportion threshold, the application combines the indicators whose proportion is lower than the proportion threshold into one indicator, and presents it in the form of other that can be expanded, so that the proportion of the displayed part that needs to be expanded becomes controllable , so as to avoid misuse of the display part that needs to be expanded.

Description

technical field [0001] This application relates to Internet technology, especially to a processing method and device for visual chart information. Background technique [0002] In the daily development of visual charts, it is often encountered that a set of data information is visualized through graphics, such as pie charts, bar charts, etc., to show the proportion of data information. Here we take the pie chart as an example. When there are too many indicators used to classify and distinguish data information, if the normal display method is used, the data information corresponding to each indicator will be densely displayed on the pie chart. Figure four week, such as figure 1 As shown, this unreasonable data information processing method undoubtedly reduces the reading experience. [0003] On the other hand, when the proportion of data information corresponding to each indicator is uneven, it is possible that most of the data information corresponding to indicators with...

Claims


Application Information

Patent Timeline
Patent Type & Authority Patents(China)
IPC IPC(8): G06F16/904
CPCG06F16/904
Inventor 王亮
Owner ALIBABA GRP HLDG LTD
Why Eureka
Try Eureka