Computer vision power flow chart-based power grid fault diagnosis method and system

A computer vision and power grid fault technology, applied in the fault location, information technology support system, measuring electricity, etc., can solve problems such as wrong measurement values, failure to find fault points, and operators' inability to determine disconnection, etc.

Active Publication Date: 2018-12-21
CHINA ELECTRIC POWER RES INST +2
View PDF4 Cites 5 Cited by
  • Summary
  • Abstract
  • Description
  • Claims
  • Application Information

AI Technical Summary

Problems solved by technology

[0003] When a fault occurs, SCADA transmits a large amount of alarm information to the operation personnel of the control center in a short time, which increases the dispatch burden of the power grid and makes it difficult to carry out fault diagnosis in time; in addition, the actual working conditions are complicated, and the operation personnel cannot It is determined that a disconnection has occurred, and the fault point cannot be found, or even if the line is determined to be faulty, the measuring device will still display a "real" wrong measurement value instead of an ideal zero value that conforms to the electrical law, which leads to the obtained The fault point data is wrong, both of which will mislead the operator to a large extent, making fault diagnosis inefficient and inaccurate

Method used


Image

  • Computer vision power flow chart-based power grid fault diagnosis method and system
  • Computer vision power flow chart-based power grid fault diagnosis method and system
  • Computer vision power flow chart-based power grid fault diagnosis method and system

Examples


Embodiment 2

[0246] Figure 7 A schematic structural diagram of a power grid fault diagnosis system based on a computer vision power flow graph according to an embodiment of the present invention is shown, as shown in Figure 7 As shown, the system may include:

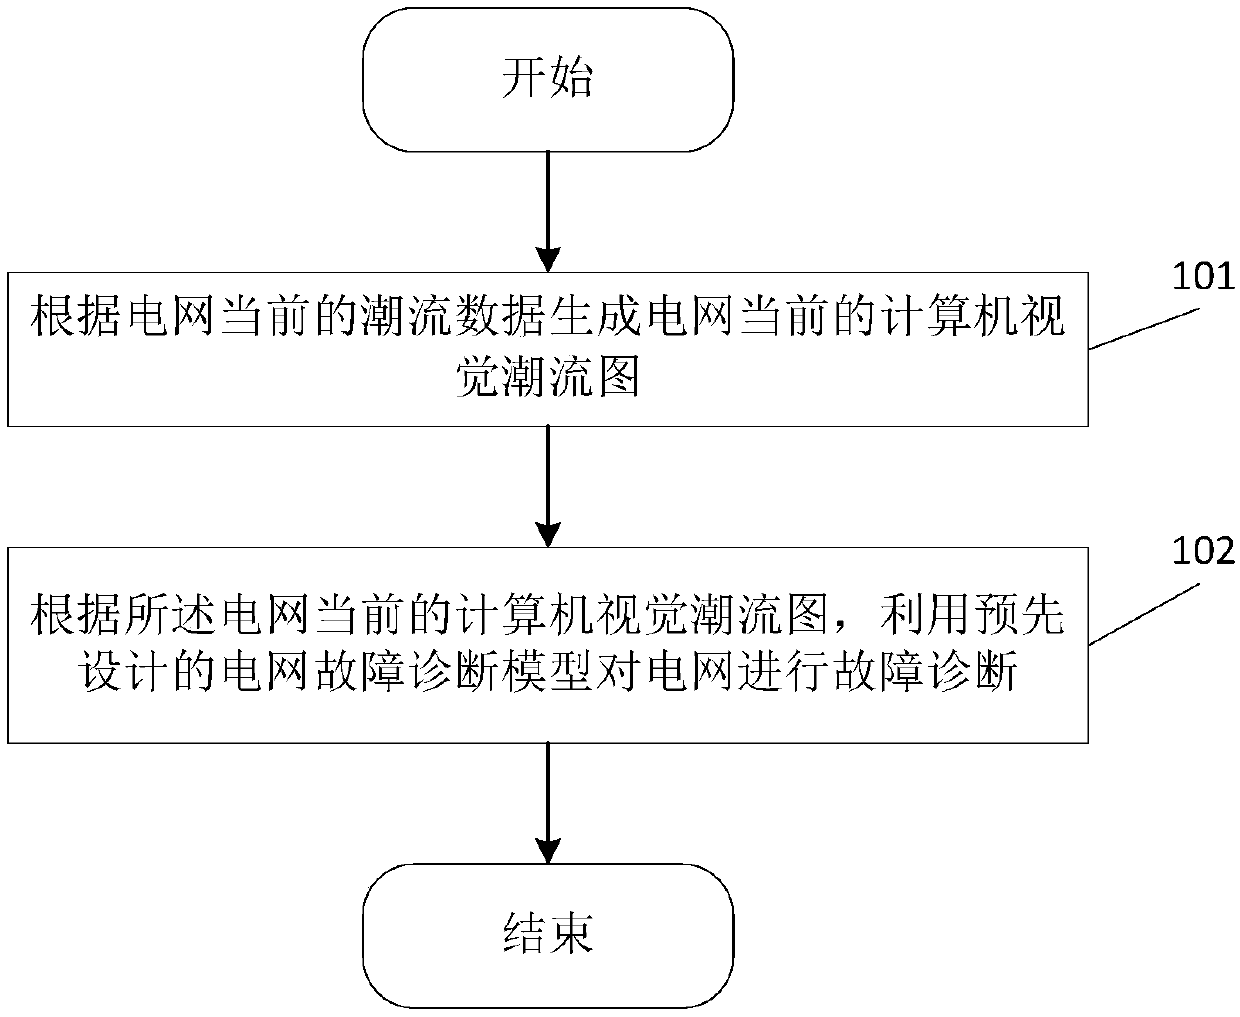
[0247] A power flow graph generating module, configured to generate a current computer vision power flow graph of the power grid according to the current power flow data of the power grid;

[0248] A diagnostic module, configured to perform fault diagnosis on the power grid using a pre-designed power grid fault diagnosis model according to the current computer vision power flow diagram of the power grid;

[0249] Wherein, the pre-designed power grid fault diagnosis model is obtained by using the historical power flow data of the power grid and its corresponding fault types as training data.

[0250] Wherein, the power flow diagram generating module may include:

[0251] The acquisition unit is used to acquire the system diagram...

Embodiment 3

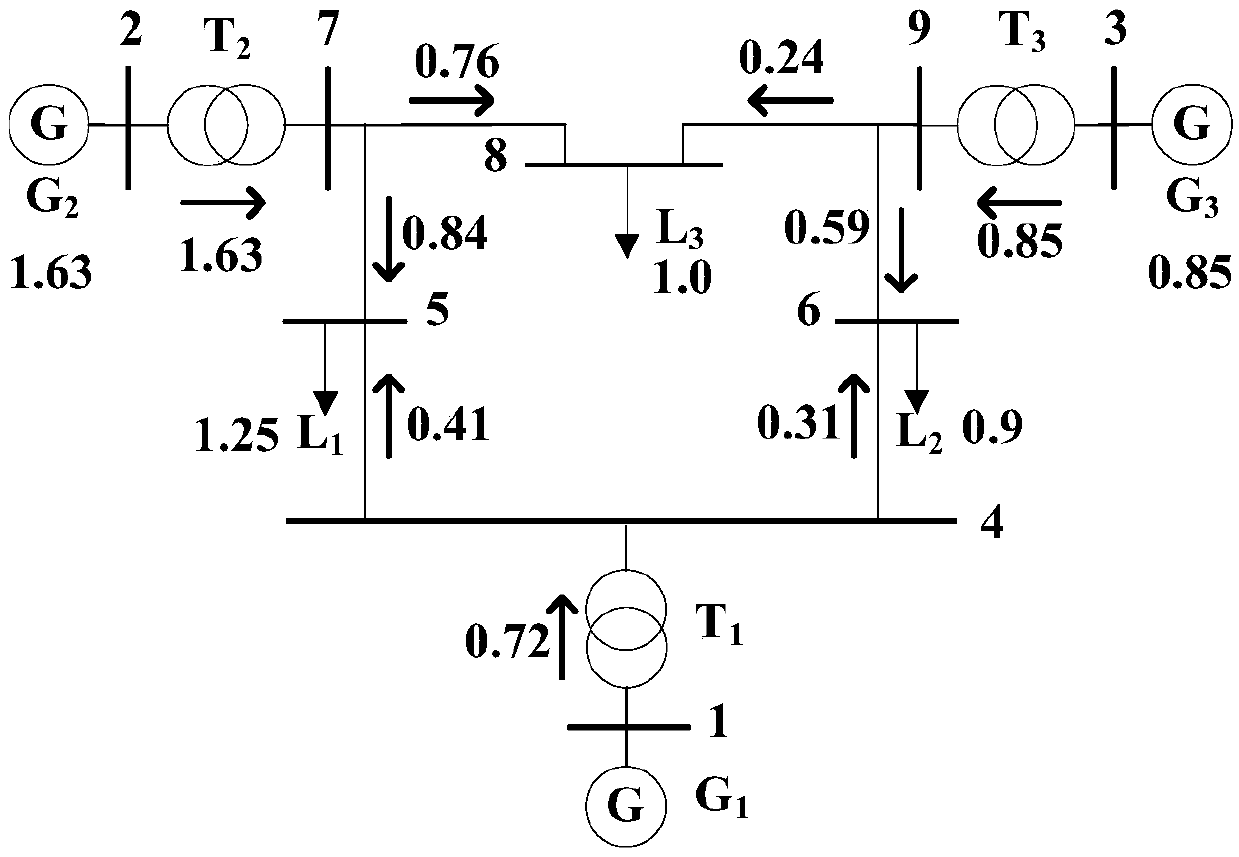
[0315] The IEEE9 system is taken as an example to describe the process of generating a large number of CVPFI samples required for training CNN, and using it to find out the transmission line that has an open circuit fault in the system.

[0316] (1). Convert the data obtained by power flow calculation into CVPFI

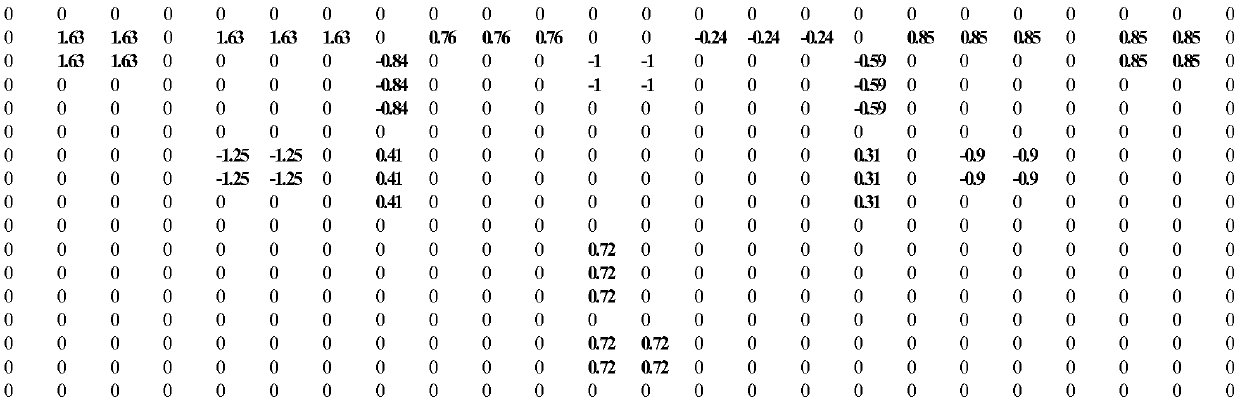
[0317] In the following, a standard IEEE9 system calculation example is used to illustrate that the power flow data (active power) of the network can be expressed in the form of a graph of 3 machines and 9 nodes after calculation, which is a "grid power flow data graph visualized by human eyes", but it cannot be directly CNN identified, it is necessary to design certain conversion rules to convert it into a computer-visualized power grid flow diagram (CVPFI).

[0318] Transform the 3-machine 9-node system diagram visualized by human eyes into a computer-visualized grid power flow matrix. The rules are as follows:

[0319] 1). Considering the scale of the network, s...


PUM


Abstract

The invention relates to a computer vision power flow chart-based power grid fault diagnosis method and system. The method comprises the steps of generating a current computer vision power flow chartof a power grid according to current power flow data of the power grid; and then carrying out fault diagnosis on the power grid by using a predesigned power grid fault diagnosis model according to thecurrent computer vision power flow chart of the power grid, wherein the predesigned power grid fault diagnosis model is obtained by using historical power flow data of the power grid and the corresponding fault type of the power grid as training data. By adopting the computer vision power flow chart-based power grid fault diagnosis method and system, the type and location of a power grid fault can be quickly and accurately diagnosed, the problem of poor portability in a traditional diagnosis technology is solved and the data scheduling pressure of the power grid is reduced.

Description

technical field [0001] The invention relates to the field of fault diagnosis of power consumption systems, in particular to a power grid fault diagnosis method and system based on computer vision power flow diagrams. Background technique [0002] The power system includes many devices such as generators, transmission lines and busbars. Operators can monitor the operating status of the system through relay protectors, circuit breakers and communication equipment; when the power system receives disturbances, operators can use data acquisition Carry out fault diagnosis and analysis with data provided by Supervisory Control and Data Acquisition (SCADA); [0003] When a fault occurs, SCADA transmits a large amount of alarm information to the operation personnel of the control center in a short time, which increases the dispatch burden of the power grid and makes it difficult to carry out fault diagnosis in time; in addition, the actual working conditions are complicated, and the ...

Claims


Application Information

Patent Timeline
Patent Type & Authority Applications(China)
IPC IPC(8): G01R31/08
CPCG01R31/088Y04S10/52
Inventor 范士雄王松岩刘幸蔚郝博文卫泽晨王伟韩巍朱承治
Owner CHINA ELECTRIC POWER RES INST
Why Eureka
Try Eureka