A network load balancing optimization method based on user data
A technology of user data and optimization methods, applied in network traffic/resource management, electrical components, wireless communication, etc., can solve problems such as inaccuracy, low efficiency and high cost, measurement that cannot meet the timeliness requirements of capacity optimization and adjustment, and achieve reduction The effect of small load rate
- Summary
- Abstract
- Description
- Claims
- Application Information
AI Technical Summary
Problems solved by technology
Method used
Image
Examples
Embodiment 1
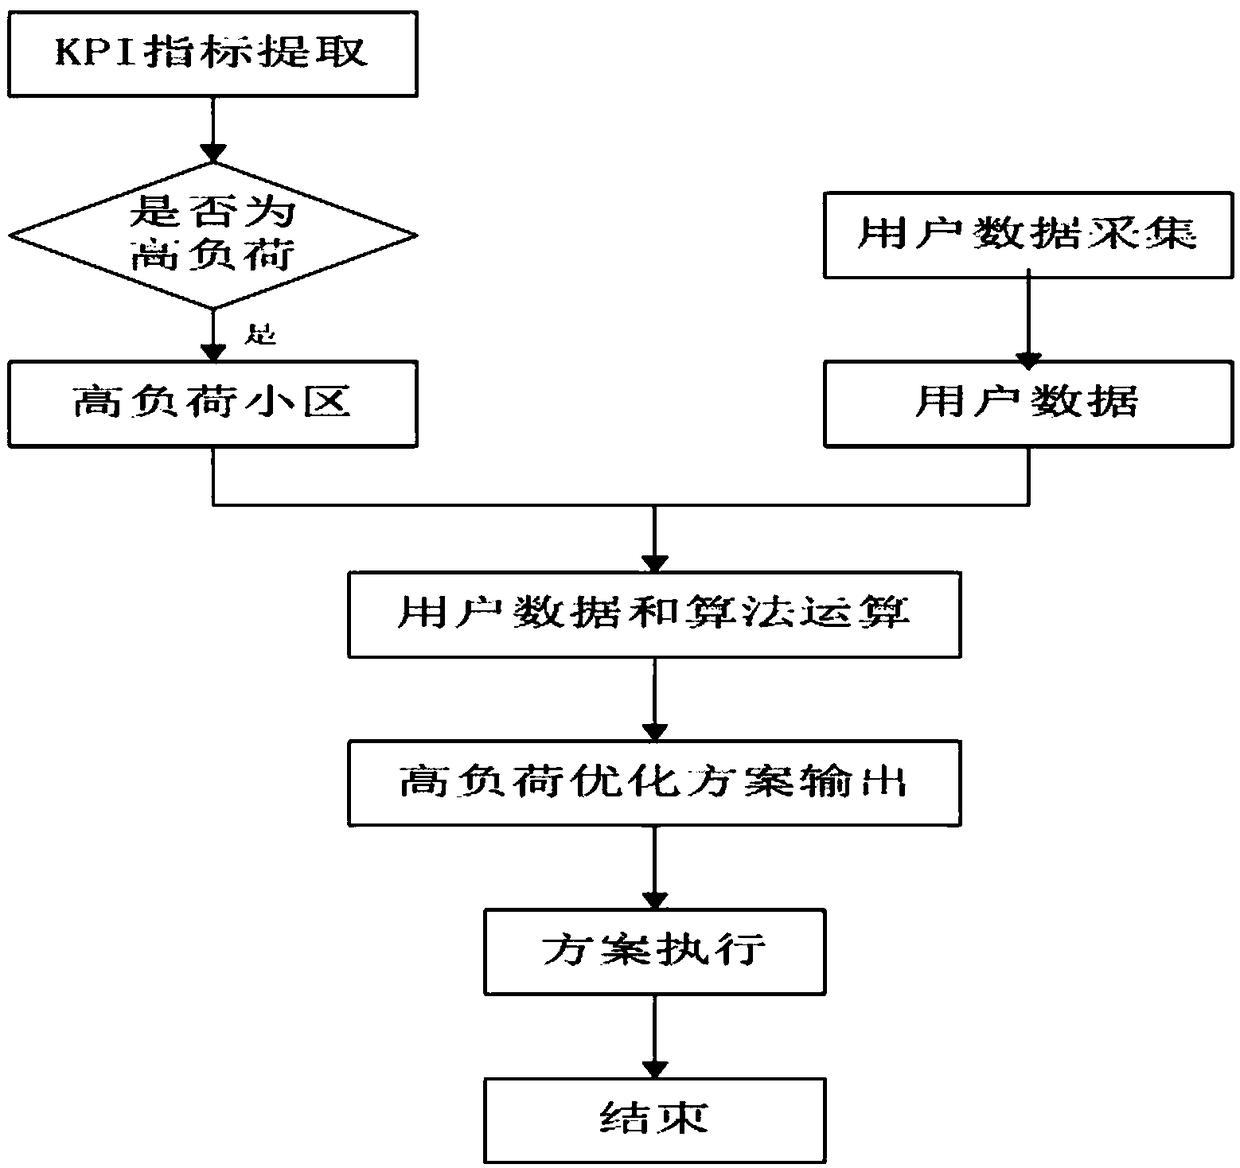
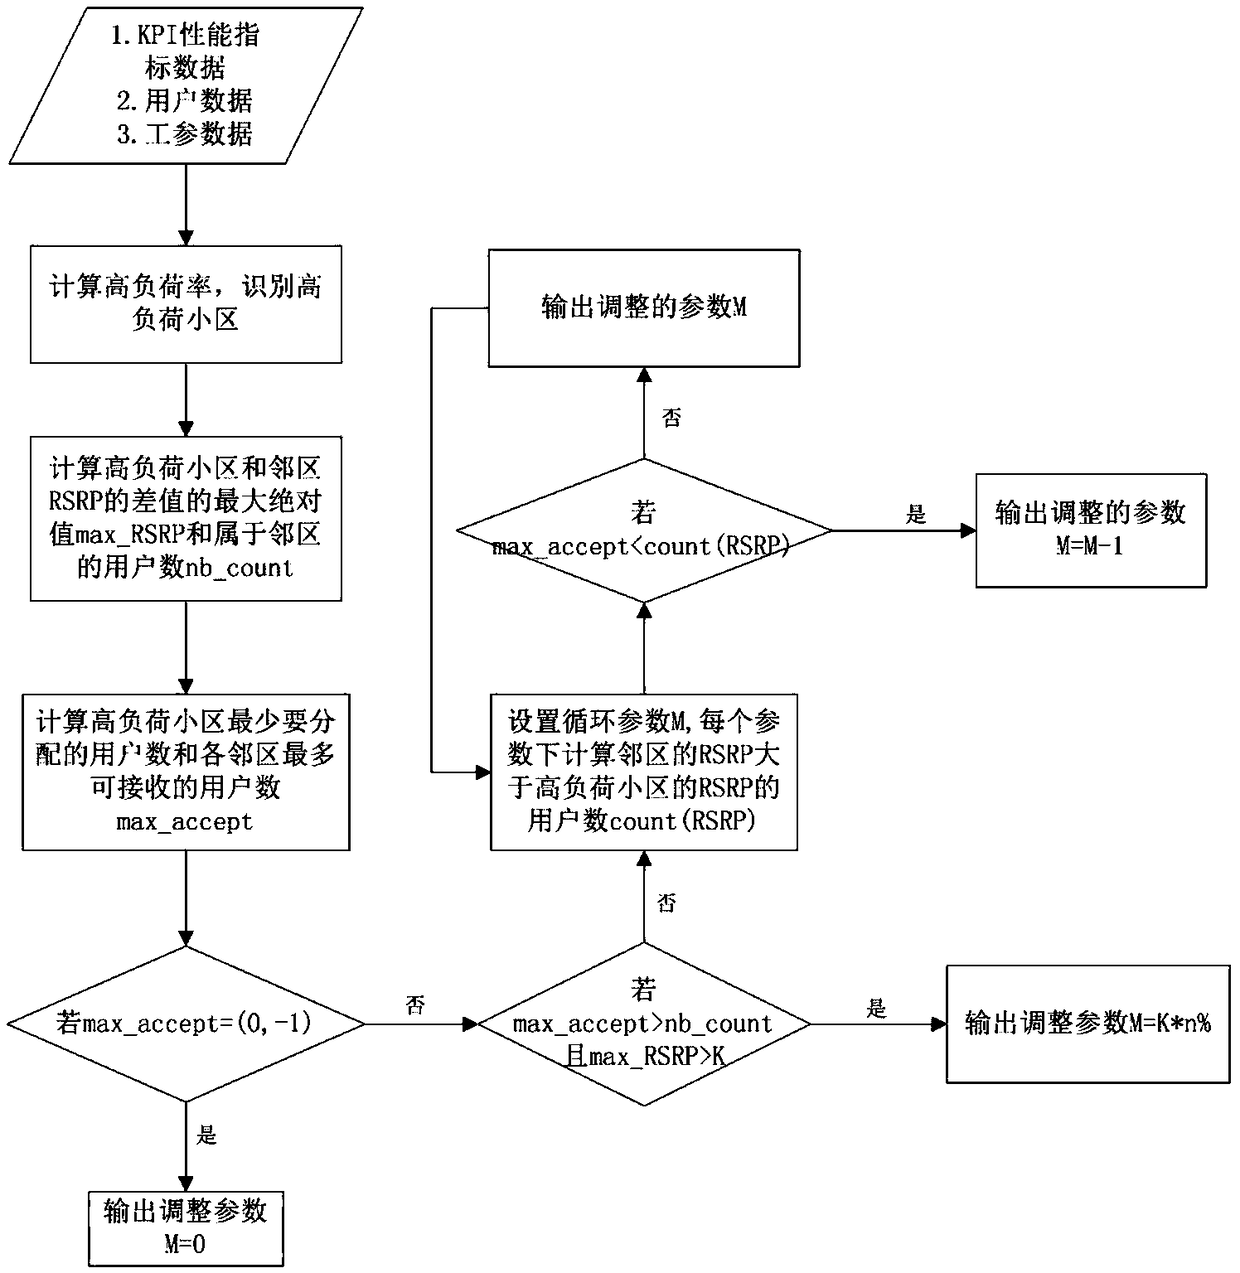
[0051] Embodiment 1: as Figure 1~2 As shown, the network load balancing optimization method based on user data includes the following steps:
[0052] (1) KPI index extraction and screening of high-load communities: extract the KPI indicators of the community, calculate the load rate of the community according to each indicator, and screen out all high-load communities;
[0053] (2) Obtain high-load cell and its user data: collect the data of the wireless network carrying the user's location reported by the user's smart terminal;
[0054] (3) User data and algorithm operation: Put the user data obtained in step (2) and the high-load data in step (1) into the model, adjust parameters through continuous iterative calculations, and output the high-load cell balancing optimization plan;
[0055] (4) Plan execution: Execute the output plan, and the closed loop ends after the execution is completed.
[0056] The user data in the step (2) includes OTT or / and MDT or / and ATU data. U...
Embodiment 2
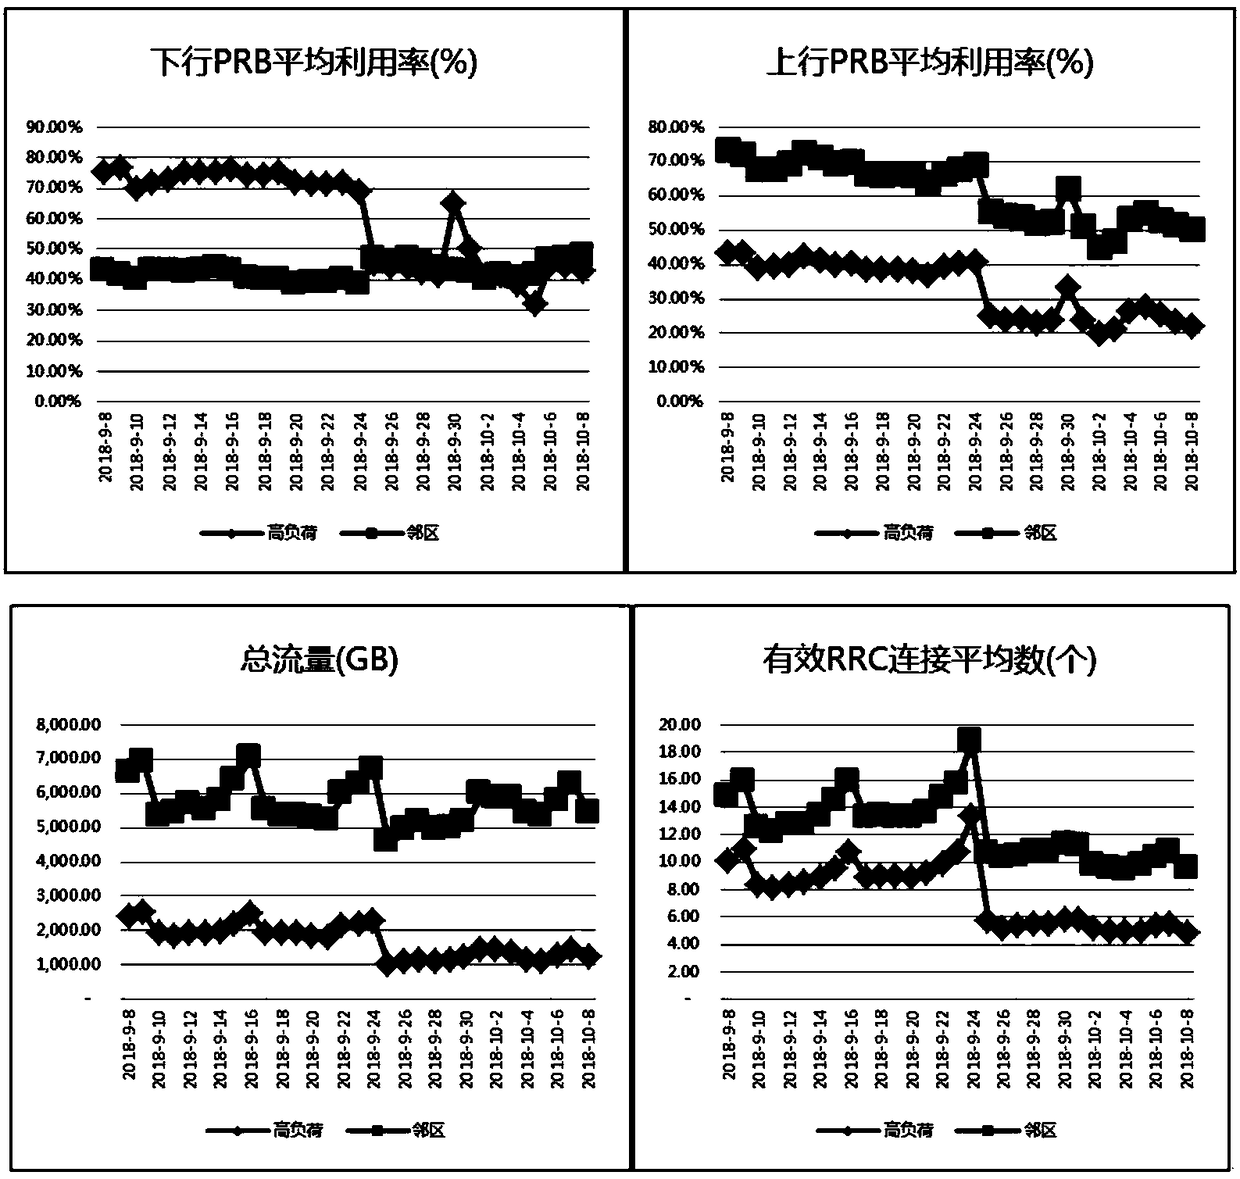
[0088] Example 2: A network load balancing optimization method based on user data is used to optimize high loads. In order to evaluate the optimization effect of this method, a high-load community in a certain province and city is selected for parameter adjustment experiments. There are 31 high-load residential areas in a certain area of the city, and 103 neighboring areas are involved. September 8-September 24 is the index change before modification, and September 26-October 8 is the parameter Changes in indicators after modification, such as image 3 Shown is to compare the results of some indicators before and after parameter adjustment.
[0089] from above image 3 It can be seen that there are 31 high-load cells, involving 103 neighboring cells. The average daily indicators before and after parameter modification, the high-load indicators are as follows:
[0090] The downlink PRB utilization rate of high-load cells decreased from 73.29% to 43.87%, an improvement of 29...
PUM
 Abstract
Description
Claims
Application Information
 - R&D
- Intellectual Property
- Life Sciences
- Materials
- Tech Scout
- Unparalleled Data Quality
- Higher Quality Content
- 60% Fewer Hallucinations
Browse by: Latest US Patents, China's latest patents, Technical Efficacy Thesaurus, Application Domain, Technology Topic, Popular Technical Reports.
© 2025 PatSnap. All rights reserved.Legal|Privacy policy|Modern Slavery Act Transparency Statement|Sitemap|About US| Contact US: help@patsnap.com


