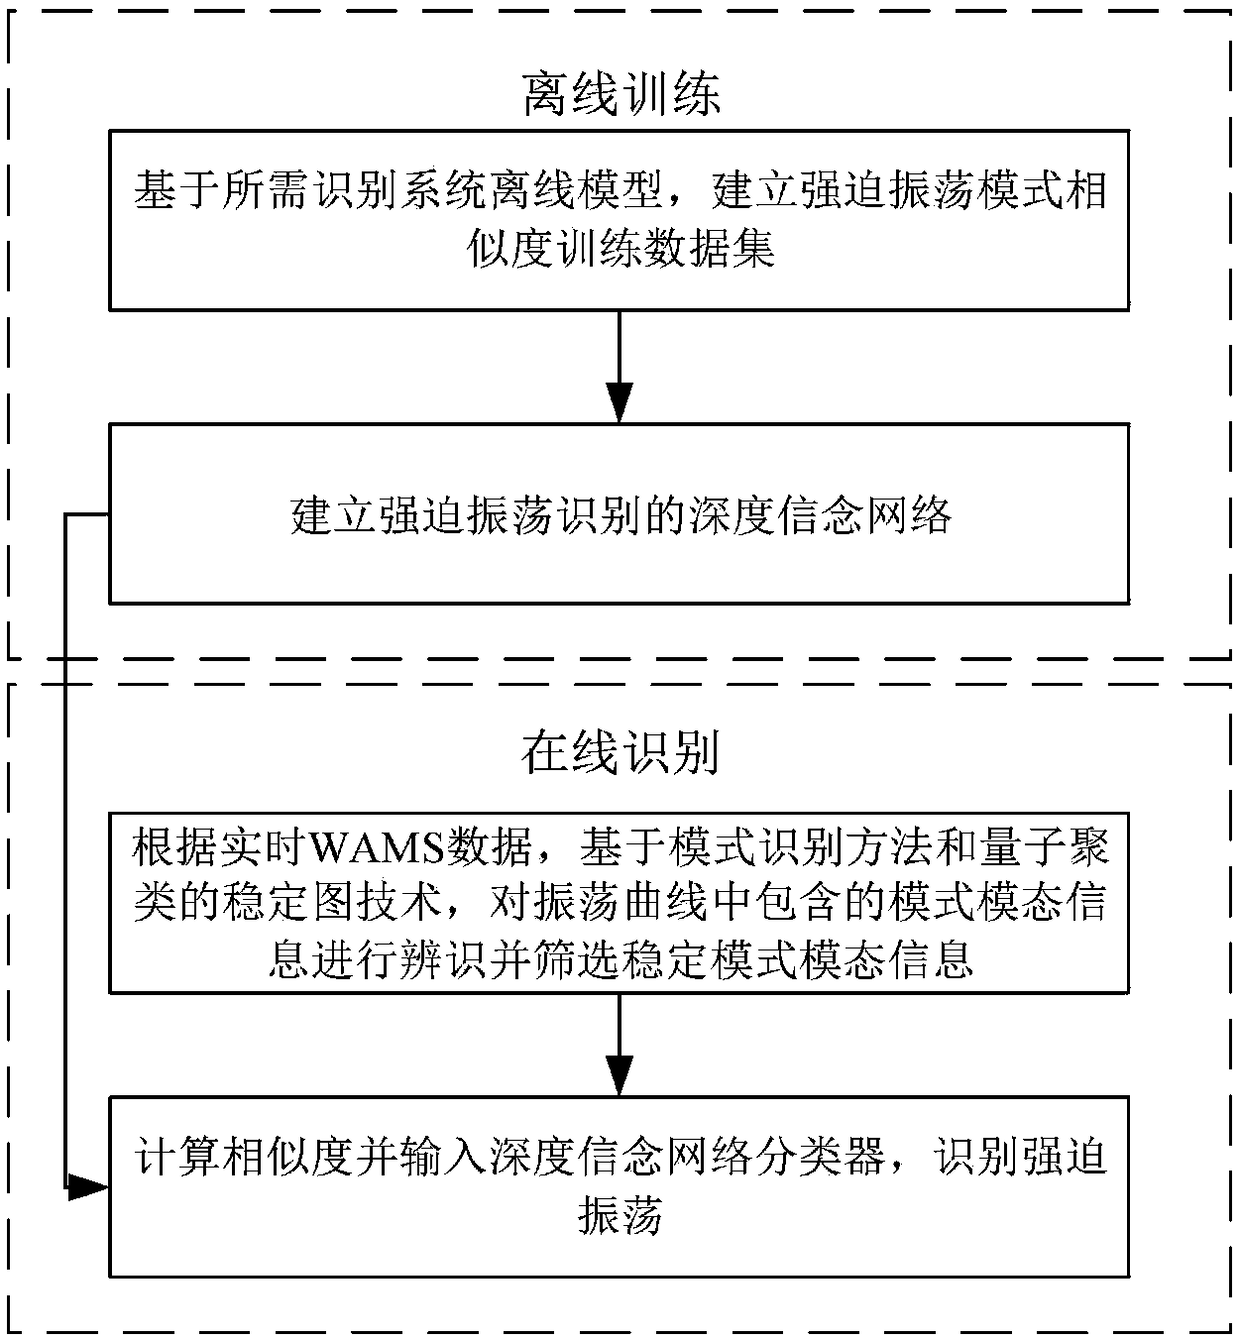
[0031] The present invention will be further described in detail below with reference to the drawings and specific embodiments. The following embodiments are only descriptive and not restrictive, and the protection scope of the present invention cannot be limited by this.
[0032] The key of the present invention is to use the free oscillation component and the mode and modal information of the forced oscillation component in the forced oscillation to identify the forced oscillation. The mode and modal characteristics of the forced oscillation are as follows:
[0033] The power system is normalized, that is, the system to be analyzed is as follows:
[0034]
[0035] It is easier to solve the equation described by the modal superposition method. The modal change matrix U is used to solve the equation. The equation changes from the existing coordinate x to the principal coordinate z. That is, it is assumed that the system can be completely After decoupling, the state equation under the new coordinates after transformation is as follows:
[0036]
[0037] Where: Λ=U -1 AU=V T AU,Ψ=U -1 B=V T B,.
[0038] The detailed derivation and analysis of the system response under the excitation of the damped sinusoidal signal show that the expression of forced oscillation is as follows:
[0039]
[0040] For y k The response expression of ∈y is as follows:
[0041]
[0042] Where: αki, ωi are the real and imaginary parts of the i-th mode of the system, Aki and Bki respectively represent the amplitude of the i-th free oscillation in the k-th observation and the amplitude of the forced oscillation excited by it, αki, βki represents the phase of the two, Bk, βk are the amplitude and phase of the total forced oscillation synthesized by the forced oscillations excited by each mode.
[0043] It can be seen from the above information that forced oscillation has the following characteristics:
[0044] The response characteristic of the forced oscillation is composed of the oscillation components of the system modes and the forced disturbance source at the same frequency.
[0045] The oscillation amplitude and phase of each mode component of the system are affected by the disturbance source and the degree of participation. The closer the mode to the disturbance source, the greater the oscillation amplitude. The relative magnitude of the participation amplitude of the same mode at different measurement points is the same as the right eigenvector. Consistent.
[0046] The amplitude and phase of the oscillating component at the same frequency as the forced disturbance are affected by all modes and disturbance sources, electromagnetic and electromechanical modes. In a strict sense, the relative amplitude and phase of the forced oscillation cannot be compared with the right eigenvector. Corresponding, but when only one oscillation mode is close to the perturbation source oscillation mode, the relative amplitude of each measurement component oscillation is roughly the same as the right eigenvector of the mode.
[0047] With reference to the accompanying drawings, a method for identifying forced oscillation based on pattern similarity is further explained, which is mainly divided into the following specific steps:
[0048] Step (1): At the beginning, based on the offline model of the required recognition system, establish a training data set of the similarity of the forced oscillation mode;
[0049] Step (2): Establish a deep belief network classifier for forced oscillation recognition based on training data;
[0050] Step (3): According to the real-time WAMS data, based on the pattern recognition method and quantum clustering stability map technology, identify the mode modal information contained in the oscillation curve and filter the stable mode modal information;
[0051] Step (4): Calculate the similarity index according to the identification information, and input the index into the depth belief network classifier to identify the forced oscillation.
[0052] In the step (1), the system model under the current typical operation mode of the power grid in the energy management system of the dispatch center is taken as the offline model of the system, and the mode modal information calculated by its small interference stable calculation is used to establish the similarity index training set, where similar Degree index (I d1 ,I d2 ) Is defined as follows:
[0053]
[0054] Where: I d1 Is the model similarity index, I d2 It is the modal similarity index.
[0055] In the step (2), the deep belief network is based on the restricted Boltzmann machine (RBM), and the similarity index (I d1 ,I d2 ) Is the input variable, and 0 represents the unforced oscillation, and 1 represents the forced oscillation as the output variable. The minimum error fine-tuning is used to optimize the corresponding weights in the neural network to establish the classifier model. Its characteristic structure is as figure 2 As shown, it is composed of multiple RBMs.
[0056] In the step (3), the random subspace method is used to identify the mode modes in the power oscillation curve recorded by the WAMS, and the quantum clustering method is used to determine the stable mode to eliminate the false mode caused by noise.
[0057] Take the stochastic subspace method (SSI) as an example, combined with the quantum stability map technology to obtain accurate mode information, and the selection steps of the mode parameters are as follows:
[0058] The SSI method is used to take the results of system identification under different orders as the sample set, select the frequency and damping information among them to form the initial sample set, initialize the parameter δ, and construct the sample with the frequency f and damping ξ under different orders calculated by a fast method Set: X = {x 1 ,x 2 …X n }, where x i =[f i ξ i ] T.
[0059] according to Calculate the potential energy function, use the gradient descent algorithm to determine the preliminary clustering center and data classification.
[0060] According to the preliminary data classification results, calculate the MAC corresponding to each sample, if the MAC <0.8 then remove the sample and count the final number of samples for each classification. If the number of samples is greater than 0.5(n max -n min )/2, it is considered stable.
[0061] Recalculate the cluster centers of stable samples as the final mode selection result and determine the corresponding order.
[0062] In the step (4), using the identified stable mode modal information, the similarity index (I d1 ,I d2 ), input it into the classifier, if the output is 0, there is no forced oscillation, and if the output is 1, it is judged as forced oscillation.
[0063] Although the embodiments and drawings of the present invention are disclosed for illustrative purposes, those skilled in the art can understand that various substitutions, changes and modifications are possible without departing from the spirit and scope of the present invention and the appended claims Therefore, the scope of the present invention is not limited to the content disclosed in the embodiments and drawings.