An import and export trade big data visual analysis system

A technology of analysis system and data analysis unit, which is applied in the field of big data visualization analysis system of import and export trade, can solve the problems of visualization, inability to achieve complete data, inability to achieve large and complete, etc., and achieve the effect of simple operation

Inactive Publication Date: 2019-03-01
大连瀚闻资讯有限公司
View PDF4 Cites 1 Cited by
  • Summary
  • Abstract
  • Description
  • Claims
  • Application Information

AI Technical Summary

Problems solved by technology

[0004] However, existing products can only do large-screen visualization, and all software is limited to one large-screen data analysis. It is impossible to visualize all the data and perform multi-layer drill ana

Method used


Image

  • An import and export trade big data visual analysis system

Examples


Embodiment 1

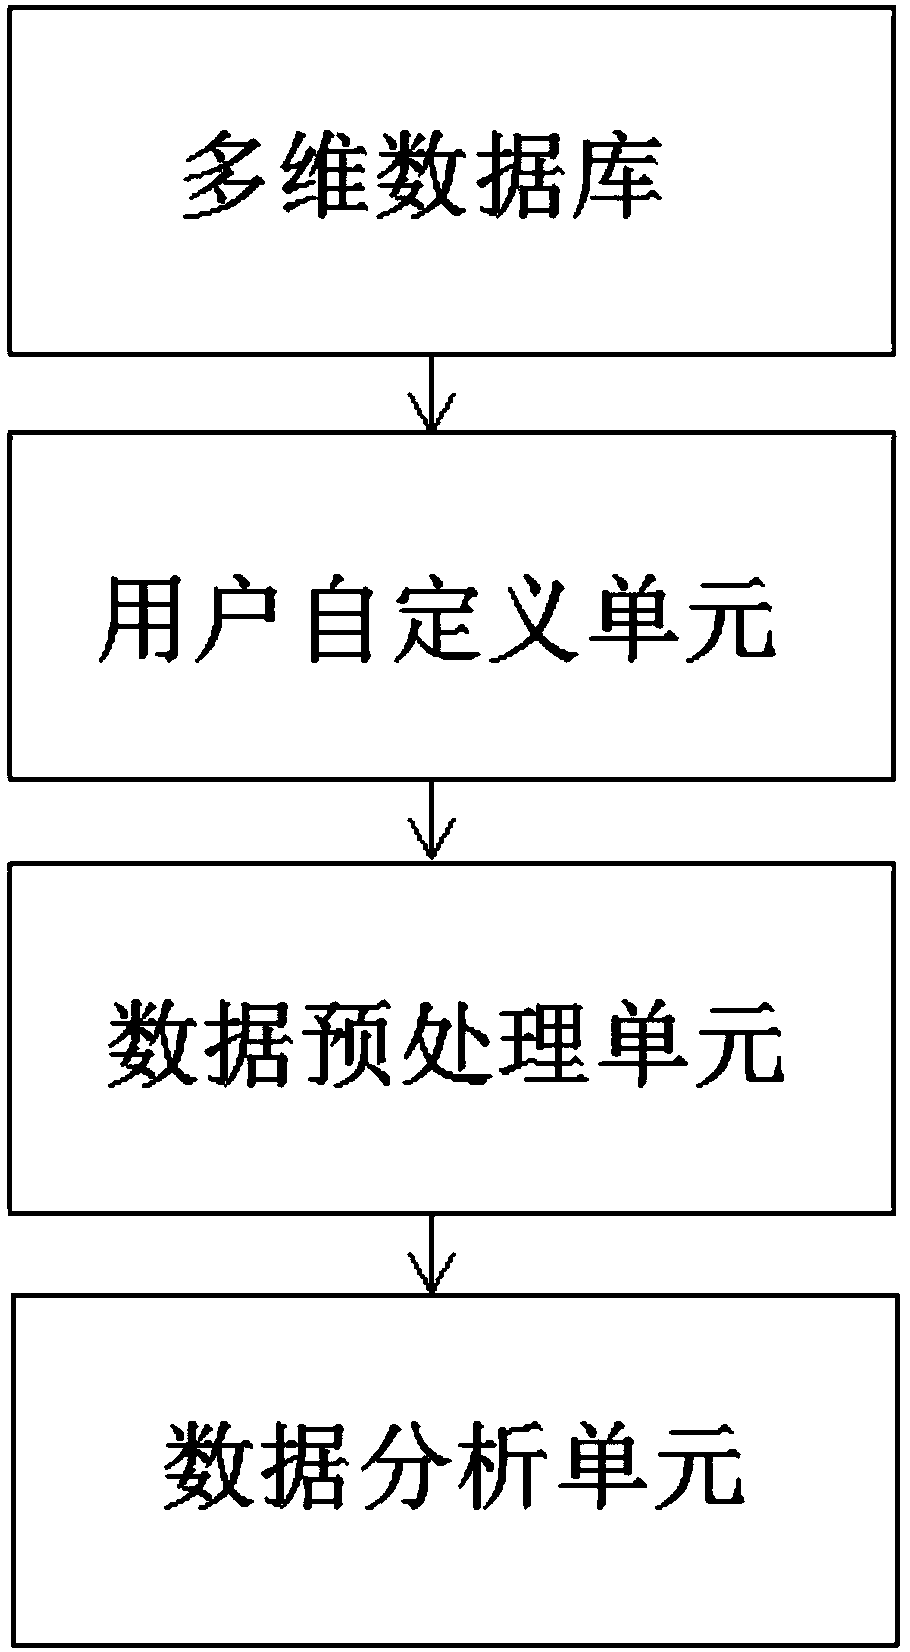
[0056] According to the dimension of import and export data, the chart shows the import and export trade between China and other countries in the world. There are three analysis methods: comparative analysis, progressive analysis, and integrated summary.

[0057]Comparative analysis: When the user chooses to query two or more screening results for the same dimension. When analyzing the chart, it mainly reflects the comparison of the screening results in all dimensions.

[0058] Progressive analysis: When the user clicks on a data item in the chart, the chart displays the import and export data of the current data item in the other 7 dimensions. The user clicks again, and the chart shows the import and export data progressively reduced to 6 dimensions.

[0059] Unified summary: Users can customize and generate dimension groups in the user center. When querying a dimension group, merge the data in the dimension group and use it as a condition for data query chart display.

...


PUM


Abstract

The invention provides an import and export trade big data visualization analysis system. The system comprises a multidimensional database, a user-defined unit, a data preprocessing unit and a data analysis unit. According to the invention, through the constructed multi-dimensional database model, the operation is simple, the import and export analysis result of the product is visually displayed,and through each analysis function, a user can better understand the global market dynamic change condition and the delivery law of competitors, so that more business opportunities hidden behind'dataand reports' are mined.

Description

technical field [0001] The present invention relates to the technical field of big data analysis, in particular to a big data visualization analysis system for import and export trade. Background technique [0002] At present, the term big data is being mentioned more and more. People use it to describe and define the massive data generated in the era of information explosion, and to name the related technological development and innovation. Data is rapidly expanding and becoming larger, which determines the future development of enterprises. Although many enterprises may not realize the hidden dangers of problems caused by explosive data growth, as time goes by, people will become more and more aware of data importance to the business. [0003] Data visualization is mainly aimed at conveying and communicating information clearly and effectively by means of graphics. Data visualization products currently on the market include: Ali DataV data visualization, Yonghong BI, sma...

Claims


Application Information

Patent Timeline
IPC IPC(8): G06F16/2457G06F16/248G06F16/28
Inventor 童友俊
Owner 大连瀚闻资讯有限公司
Why Eureka
Try Eureka