Thiessen polygon grid-based power grid load visualization method

A technology of Tyson polygon and power grid load, applied in the field of smart grid GIS, can solve problems such as unfavorable grid management, inability to provide data connection and geographical distribution rules, blurred geographical distribution area boundaries, etc., to achieve the effect of auxiliary management

Active Publication Date: 2019-07-09
NARI TECH CO LTD +2
View PDF7 Cites 5 Cited by
  • Summary
  • Abstract
  • Description
  • Claims
  • Application Information

AI Technical Summary

Problems solved by technology

Its disadvantage is that in the visual expression of single-point symbolization, the connection between data and the geographical distribution law cannot be given; in the visual expression of contour lines, the boundaries of the geographical distribution area of ​​​​operation characteristic indicators are blurred, which is not conducive to grid management

Method used


Image

  • Thiessen polygon grid-based power grid load visualization method
  • Thiessen polygon grid-based power grid load visualization method

Examples


Embodiment Construction

[0024] The technical solutions of the present invention will be further described below in conjunction with the accompanying drawings and embodiments.

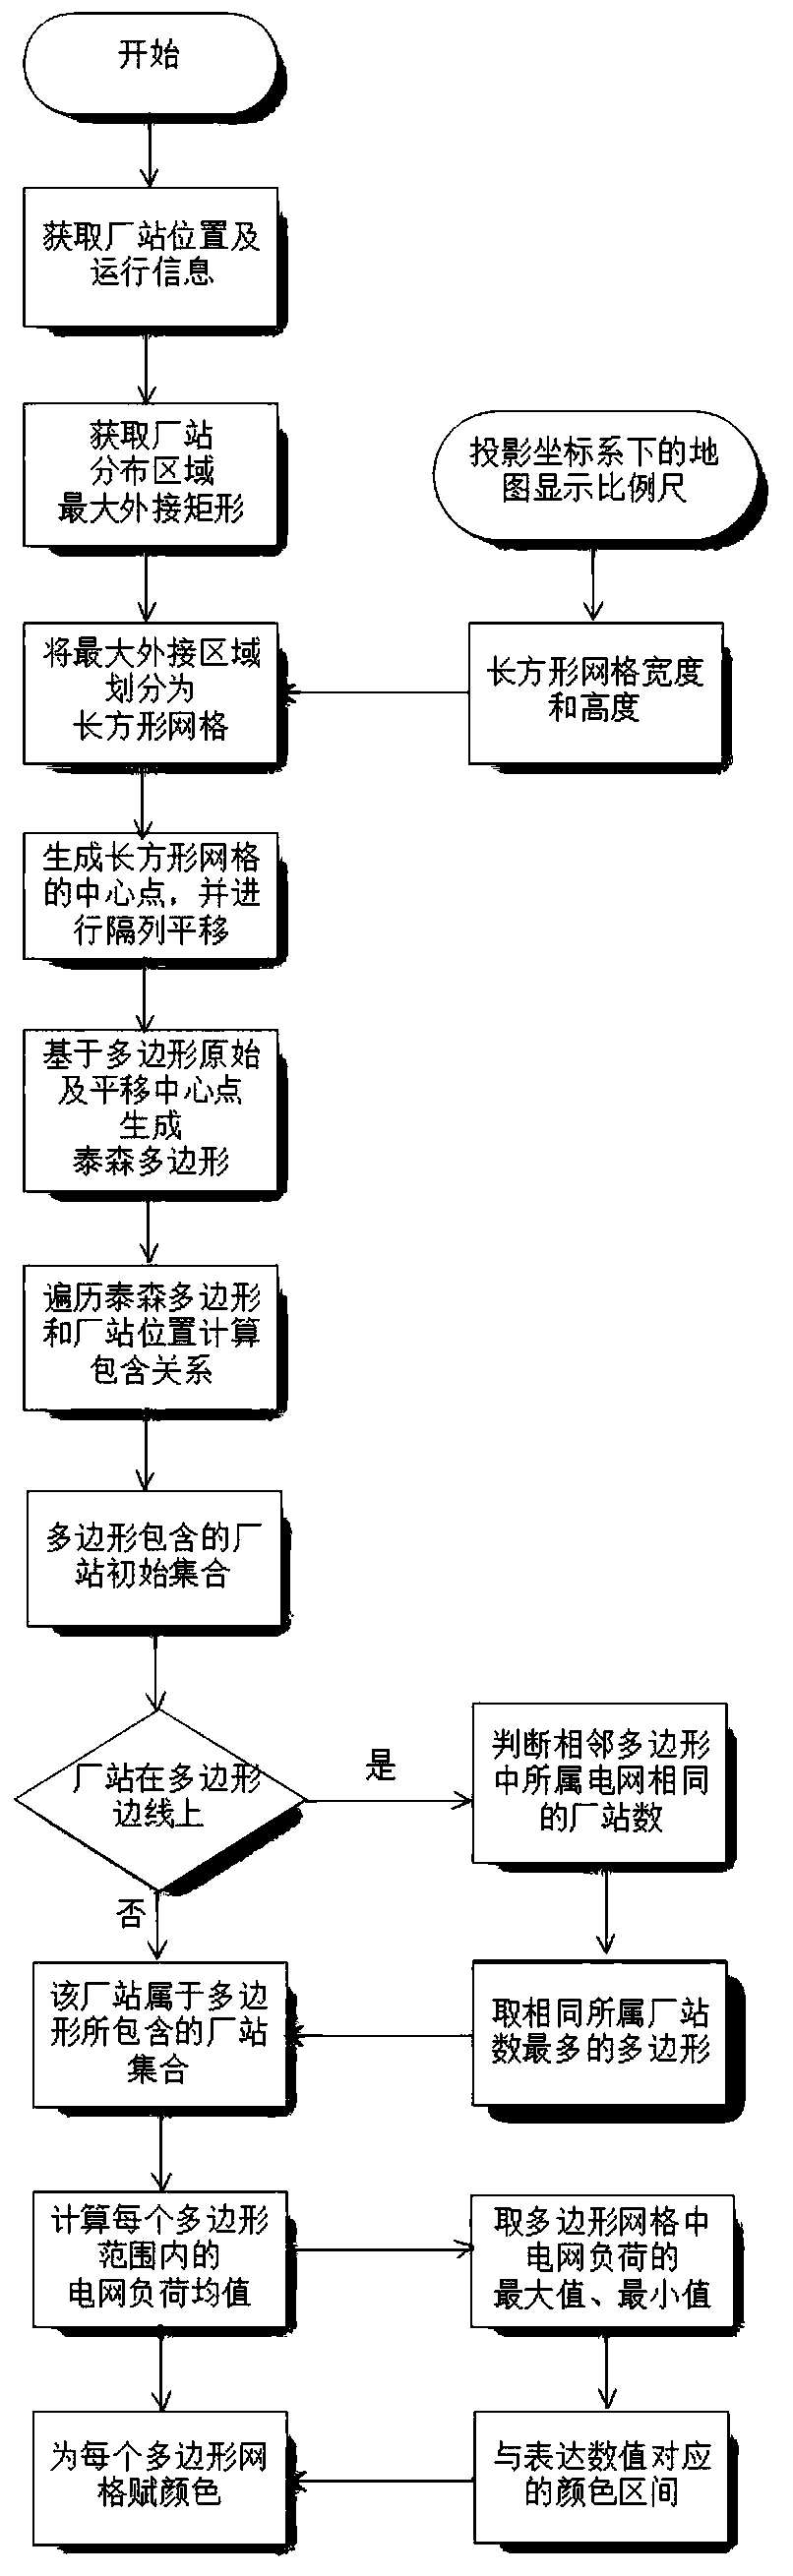
[0025] Such as figure 1 As shown, the grid load visualization method based on Thiessen polygon grid of the present invention comprises steps:

[0026] S1: Based on the historical data or real-time data of the power station operation, combined with the spatial location information of the power station, the power grid operation load and spatial information data are obtained;

[0027] S2: Obtain the largest circumscribed rectangle of the plant distribution area based on the geographical distribution of the plant;

[0028] S3: Divide the largest circumscribed area into several rectangular grids, and draw up an appropriate grid size according to the display scale of the current map in the projected coordinate system;

[0029] S4: According to the rectangular grid generated in the previous step, generate the center point of the gr...


PUM


Abstract

The invention discloses a Thiessen polygon grid-based power grid load visualization method, which comprises the following steps of: (1) obtaining power grid operation load and space information data based on historical operation data or real-time operation data of a plant station in combination with space position information; (2) generating a Thiessen polygon grid based on the geographic distribution of the plant stations; (3) traversing the Thiessen polygon mesh, and obtaining a plant station contained in the polygon mesh according to the topological nine-intersection model; (4) carrying outstatistical value processing on the plant and station load information in each grid, and carrying out statistics on a minimum value, a maximum value, a median value and an average value; (5) countingthe minimum value and the maximum value of the power grid load of the grid unit in the whole area; and (6) establishing color intervals corresponding to different numerical values using values of thecolor intervals corresponding to the median numbers obtained through statistics in each grid and coloring the polygonal grid. According to the invention, the power grid operation load geographic areadistribution condition can be effectively displayed. Therefore, the belonging power grid information can be considered, the grid area with higher load can be displayed with a clear boundary, and thegrid management is assisted.

Description

technical field [0001] The invention belongs to the technical field of smart grid GIS, in particular to a grid load visualization method based on Thiessen polygon grid. Background technique [0002] As the power grid system becomes increasingly complex and large, the system generates a large amount of operating data such as voltage, current, and power during operation, providing data support for the safe and stable operation and management of the power grid, and also puts forward higher requirements for the ability of visual display to assist decision-making. These operating data are displayed on the geographic wiring diagram of the power system in a single-point symbolic manner, which cannot give the connection between the data and the geographical distribution rules. Fuzzy, not conducive to grid management. For large-scale networks, it is necessary to carry out grid-based visual display of the key significance data of operation and equipment, and display the regional dist...

Claims


Application Information

Patent Timeline
Patent Type & Authority Applications(China)
IPC IPC(8): G06Q10/06G06Q50/06G06F16/29
CPCG06Q10/0639G06Q50/06
Inventor 何源黄昆赵昆房彩申
Owner NARI TECH CO LTD
Why Eureka
Try Eureka