A Single Frequency Signal Frequency Estimation Method Based on Synthetic Interpolation of Discrete Spectrum Phase and Amplitude

A single-frequency signal and discrete spectrum technology, applied in the field of signal processing, can solve the problems of small calculation amount, high noise sensitivity, large error of Rife interpolation method, etc., and achieve the effect of improving the accuracy of frequency estimation

Active Publication Date: 2021-03-16
SOUTHEAST UNIV
View PDF12 Cites 0 Cited by
  • Summary
  • Abstract
  • Description
  • Claims
  • Application Information

AI Technical Summary

Problems solved by technology

The Rife interpolation method and the Quinn interpolation method use the amplitude ratio and real part ratio of the two spectral lines in the main lobe of the discrete spectrum of the signal to perform interpolation. Only one DFT operation is required, and the implementation is simple, the calculation amount is small, and the most widely obtained Application and research, but when the relative frequency deviation is small, the error of the Rife interpolation method is large, and the Quinn interpolation method only uses the ratio of the real part of the spectral line for frequency interpolation, which is highly sensitive to noise

Method used


Image

  • A Single Frequency Signal Frequency Estimation Method Based on Synthetic Interpolation of Discrete Spectrum Phase and Amplitude
  • A Single Frequency Signal Frequency Estimation Method Based on Synthetic Interpolation of Discrete Spectrum Phase and Amplitude
  • A Single Frequency Signal Frequency Estimation Method Based on Synthetic Interpolation of Discrete Spectrum Phase and Amplitude

Examples


Embodiment 1

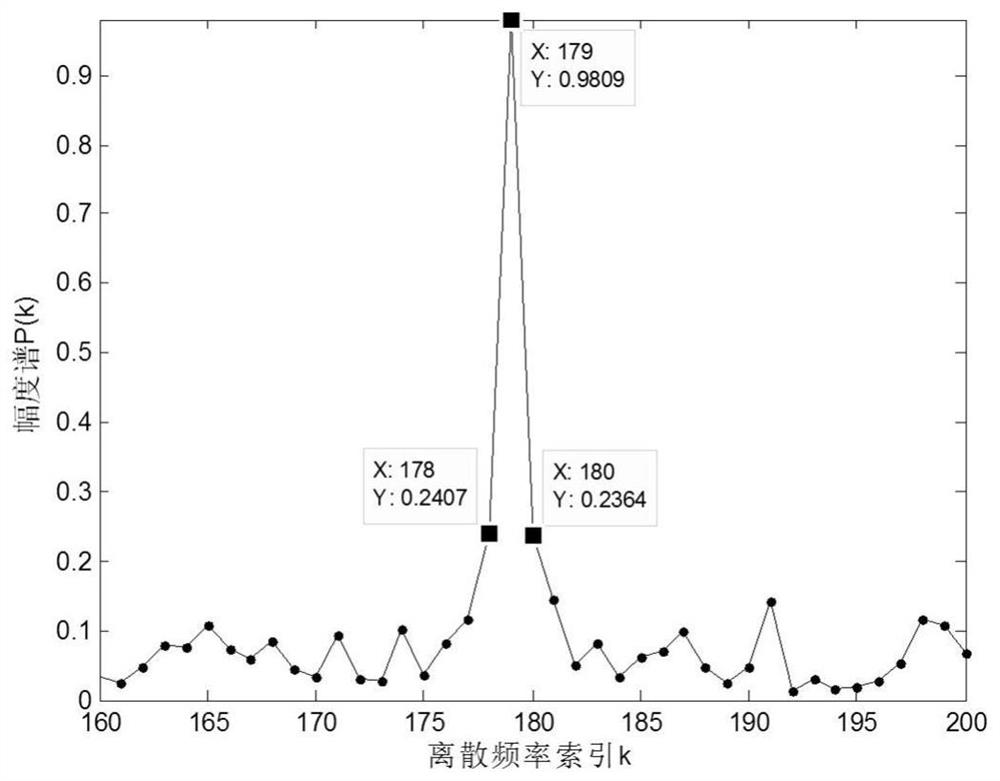
[0087] The simulation signal parameters are set as follows: signal amplitude A=1, initial phase Pulse width τ=0.512s, signal center frequency f 0 =700Hz, sampling frequency f s =4000Hz, observation data sequence points N=1024, corresponding frequency resolution Δf=f s / N=4000 / 1024=3.9063, the relative frequency deviation is δ=0.2, the maximum peak frequency index is 179, and the signal-to-noise ratio SNR=-3dB.

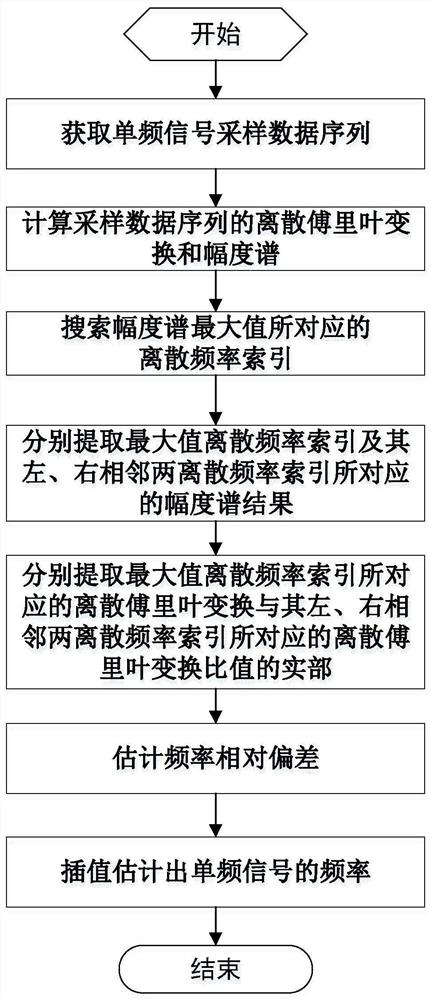
[0088] According to (2) step, calculate the discrete Fourier transform X (l) and amplitude spectrum P (k) of described data sequence x (n), P (k) is as figure 2 shown.

[0089] According to step (3), search for the discrete frequency index k corresponding to the maximum value of the amplitude spectrum P(k) 0 =179.

[0090] According to step (4), extract the maximum discrete frequency index k 0 and its left and right adjacent two discrete frequency indices k 0 -1 and k 0 The amplitude spectrum result corresponding to +1

[0091] A l =|X(k 0 -1)|=0.2407

[...

Embodiment 2

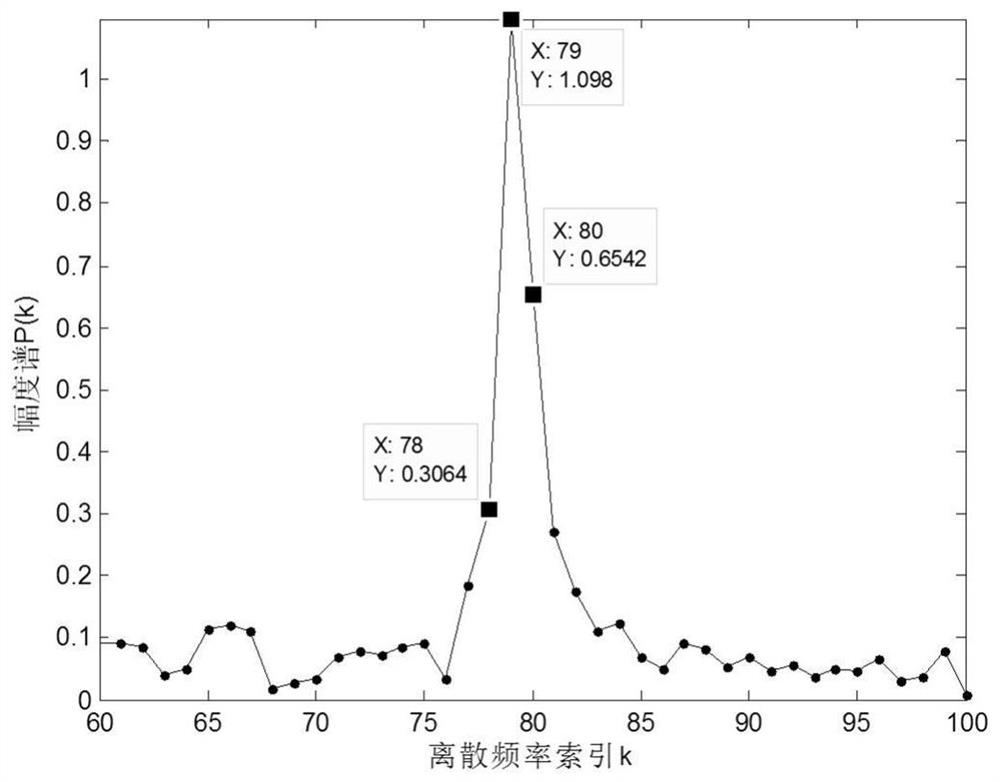
[0107] The simulation signal parameters are set as follows: signal amplitude A=2, initial phase Pulse width τ=0.512s, signal center frequency f 0 =310Hz, sampling frequency f s =4000Hz, observation data sequence points N=1024, corresponding frequency resolution Δf=f s / N=4000 / 1024=3.9063, the relative frequency deviation is δ=0.36, the maximum peak frequency index is 79, and the signal-to-noise ratio SNR=0dB.

[0108] According to step (2), calculate the discrete Fourier transform X(l) and amplitude spectrum P(k) of the data sequence x(n).

[0109] According to step (3), search for the discrete frequency index k corresponding to the maximum value of the amplitude spectrum P(k) 0 =180.

[0110] According to step (4), extract the maximum discrete frequency index k 0 and its left and right adjacent two discrete frequency indices k 0 -1 and k 0 The amplitude spectrum result corresponding to +1:

[0111] A l =|X(k 0 -1)|=0.3064

[0112] A m =|X(k 0 )|=1.0985

[0113] A...


PUM


Abstract

The invention discloses a simple-frequency signal frequency estimating method based on discrete spectrum phase and amplitude integrated interpolation. The simple-frequency signal frequency estimatingmethod includes the following steps that: firstly, sample data sequences of the simple-frequency signal are obtained; secondly, discrete fourier transformation and a magnitude spectrum in the sample data sequences are computed; thirdly, discrete frequency index corresponding to the maximum of the magnitude spectrum is searched; fourthly, maximum discrete frequency index and outcomes of the magnitude spectrumcorresponding to the two adjacent left and rightdiscrete frequency indexare extracted correspondingly; fifthly, the real part of the ratio of the discrete fourier transformation corresponding to the maximum discrete frequency index and the discrete fourier transformationcorresponding to the two adjacent left and rightdiscrete frequency indexare extracted correspondingly; sixthly, frequency relative deviationis estimated; and seventhly, the frequency of the simple-frequency signal is estimated in an interpolation manner. According to the simple-frequency signal frequency estimating method, on the premise of not increasing computation amount, the precision of estimating the frequency of the simple-frequency signal is improved, and the simple-frequency signal frequency estimating method is suitable for real-time and high-precision estimation the frequency of the simple-frequency signal.

Description

technical field [0001] The invention belongs to the technical field of signal processing, in particular to a method for estimating the frequency of a single-frequency signal based on integrated interpolation of discrete spectrum phase and amplitude. Background technique [0002] Single-frequency signals are widely used in the fields of communication, radar, sonar, and electronic warfare, especially in the fields of radar and sonar. Accurate frequency estimation of single-frequency signals polluted by noise has always been an important part of signal processing. one of the research hotspots. [0003] At present, scholars at home and abroad have proposed many frequency estimation algorithms for single-frequency signals, mainly including the maximum likelihood estimation method and the method based on discrete Fourier transform (DFT) spectrum correction interpolation. Under the condition of high signal-to-noise ratio, the maximum likelihood method has the best estimation perfo...

Claims


Application Information

Patent Timeline
Patent Type & Authority Patents(China)
IPC IPC(8): G01R23/16G01R23/10
CPCG01R23/10G01R23/16
Inventor 姚帅方世良王晓燕曹红丽
Owner SOUTHEAST UNIV
Why Eureka
Try Eureka