Visual display method and system for power grid operation risk monitoring

A power grid operation and display system technology, applied in the direction of instruments, data processing applications, resources, etc., can solve the problems of not introducing probability analysis and establishing a risk index system, failing to reflect the degree of risk and the cause of risk, so as to improve defense capabilities and guarantee The effect of safe and stable operation

Inactive Publication Date: 2019-08-27
STATE GRID CORP OF CHINA +2
View PDF5 Cites 7 Cited by
  • Summary
  • Abstract
  • Description
  • Claims
  • Application Information

AI Technical Summary

Problems solved by technology

The deterministic method is based on the safe and stable operation of the power grid after an artificially specified expected failure scenario (usually N-1) occurs. Failure to introduce probability analysis and establish a risk indicator system, failing to reflect the influence of uncertain factors, the degree of risk in various aspects and the causes of risk other than equipment

Method used


Image

  • Visual display method and system for power grid operation risk monitoring
  • Visual display method and system for power grid operation risk monitoring
  • Visual display method and system for power grid operation risk monitoring

Examples


Embodiment Construction

[0034] The present invention will be further explained below in conjunction with the accompanying drawings and specific embodiments.

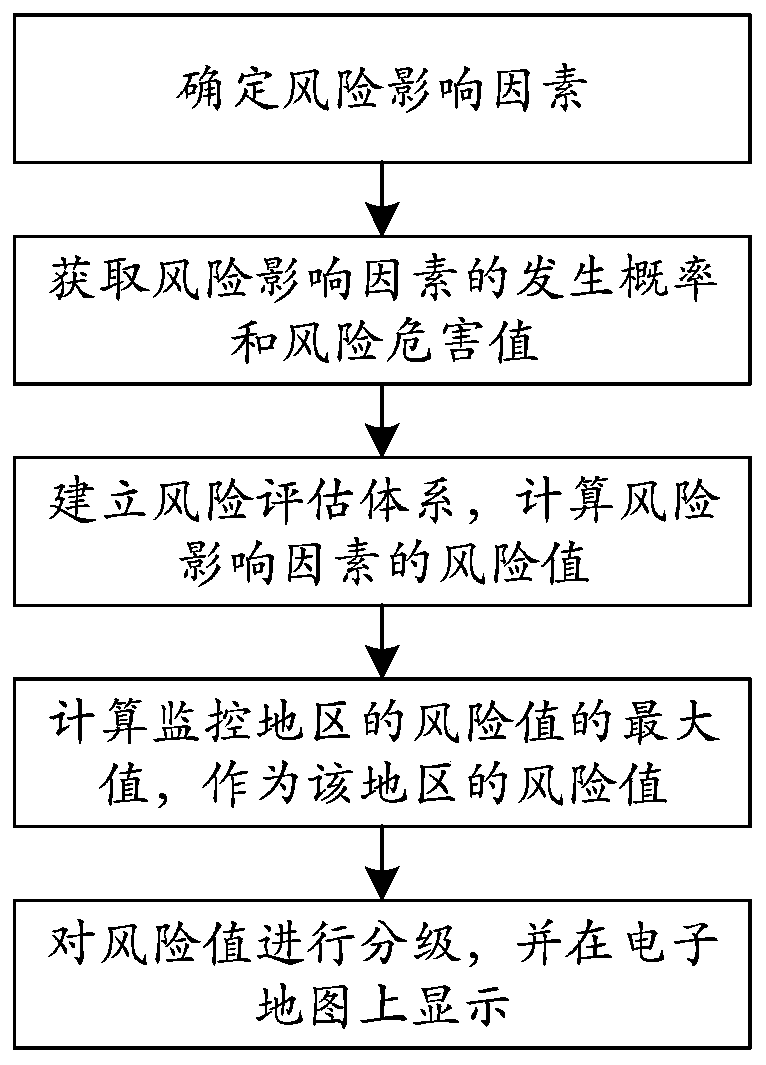
[0035] Such as figure 1 As shown, a visual display method for power grid operation risk monitoring includes the following steps:

[0036] Step 1. Determine the internal influencing factors and external influencing factors in the operation of the power grid, and form the source of risk S={S i}; i=1,2,...,N; N is the number of risk factors;

[0037] The internal influencing factors in the operation of the power grid include equipment failures and system operating conditions; the external influencing factors include the deterioration of the natural environment and human errors.

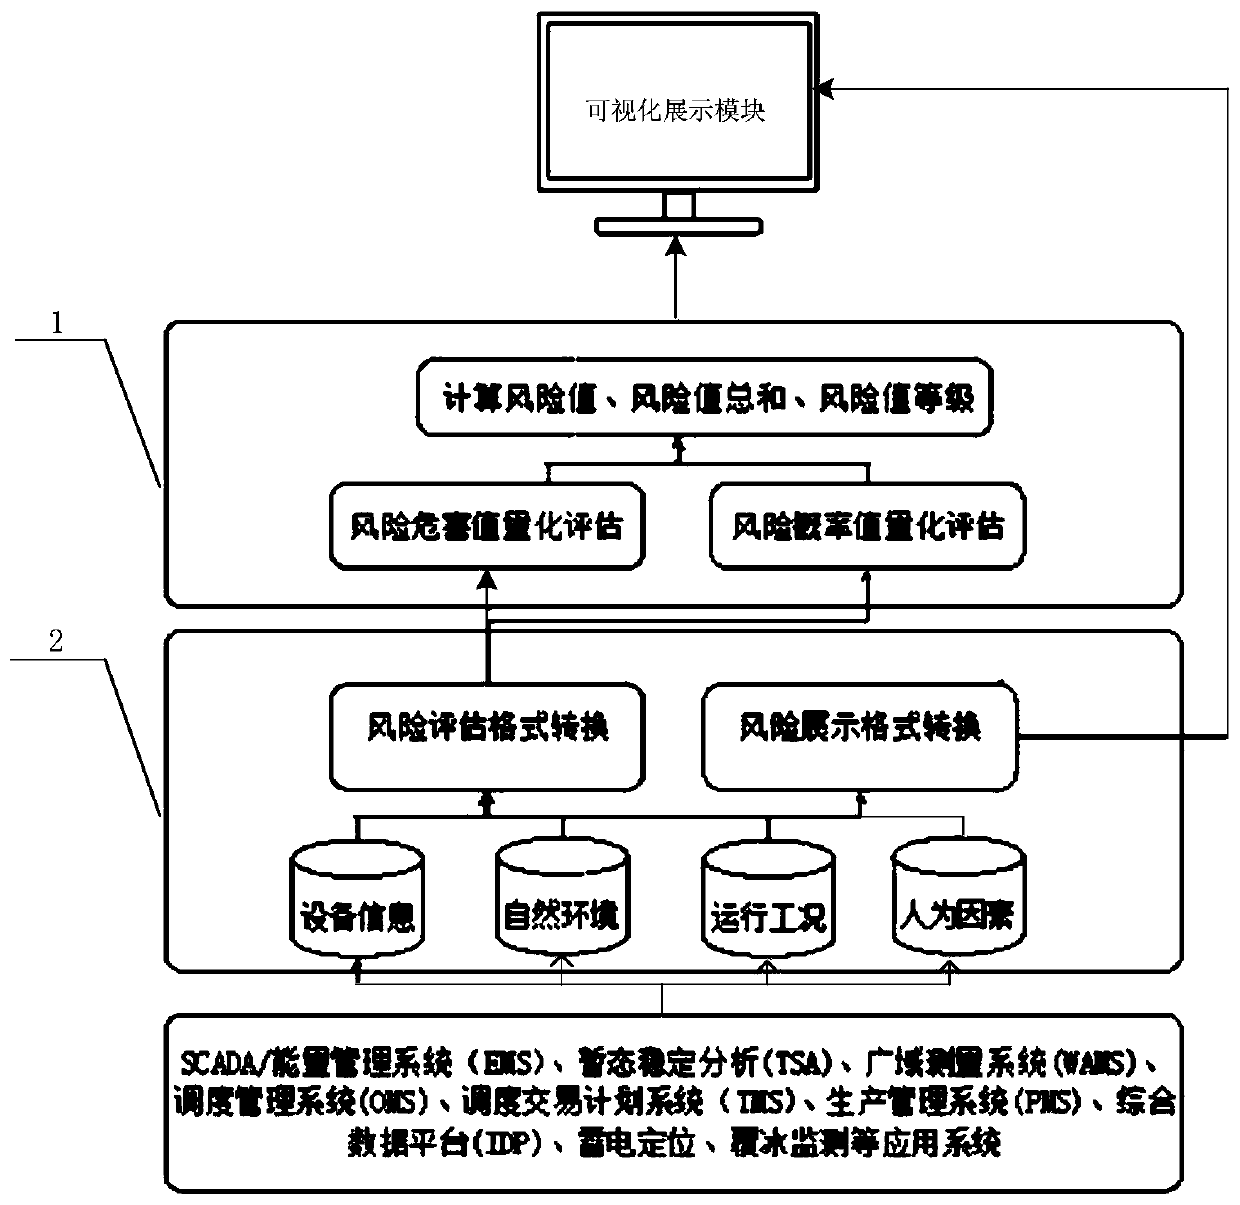
[0038]Power grid operation risk information collection, the safe and stable operation of the power grid is affected by various uncertain factors (that is, risk sources), and risk analysis and evaluation can be carried out from multiple perspectives such as equipment, na...


PUM


Abstract

The invention discloses a visual display method and system for power grid operation risk monitoring. The visual display method comprises the following steps of 1, determining the internal influence factors and the external influence factors in the power grid operation, and forming a risk source, 2, obtaining the occurrence probability and the risk hazard value of each risk influence factor, 3, establishing a risk assessment system, and calculating a risk value of each risk influence factor, 4, taking the maximum value of the risk values of all risk influence factors of the power grid operationin the monitoring area as the risk value of the monitoring area, and 5, dividing the risk value into a plurality of grades, and displaying the risk value grade of the risk influence factor in the power grid operation of the monitoring area in an electronic map. According to the method, the internal factors and the external factors in the power grid operation are considered at the same time, so that the power grid operation risk can be more comprehensively evaluated and can be visually displayed.

Description

technical field [0001] The invention belongs to the technical field of power grid operation monitoring, and in particular relates to a method and system capable of visually monitoring power grid operation risks. Background technique [0002] The domestic power grid has developed into a new UHV AC-DC hybrid power grid. The coupling between power grid sending and receiving ends, AC and DC, and upper and lower levels is becoming increasingly tight, and the risk of AC and DC cascading failures is becoming increasingly prominent. The traditional empirical dispatching mode is difficult to meet the needs of safe operation of large power grids. At the same time, the power grid dispatching operation is facing enormous pressure in dispatching mode, safety management mode, clean energy consumption mode, etc., which puts forward higher requirements for the lean management of power grid dispatching operation. [0003] Regarding the risk assessment of power grid operation, foreign schola...

Claims


Application Information

Patent Timeline
Patent Type & Authority Applications(China)
IPC IPC(8): G06Q10/06G06Q50/06
CPCG06Q10/0635G06Q50/06
Inventor 高保成赵林陈国平孟鑫申亚超李洋朱晓松张令涛冷喜武于之虹吕颖鲁广明解梅史东宇
Owner STATE GRID CORP OF CHINA
Why Eureka
Try Eureka