Electroencephalogram time frequency information visualizing method

A technology of EEG and EEG data, applied in the field of visualization, can solve the problems of ignoring the characteristics of pathological waves and the inability to observe high-frequency signal changes, and achieve the effect of reducing the difficulty of monitoring and facilitating diagnosis

Inactive Publication Date: 2019-09-20
NEURACLE TECH CHANGZHOU CO LTD
View PDF6 Cites 2 Cited by
  • Summary
  • Abstract
  • Description
  • Claims
  • Application Information

AI Technical Summary

Problems solved by technology

However, if doctors observe EEG waveforms in this way, they often cannot observe the changes of high-frequency signals, thus ignoring the characteristics of pathological waves.

Method used


Image

  • Electroencephalogram time frequency information visualizing method
  • Electroencephalogram time frequency information visualizing method
  • Electroencephalogram time frequency information visualizing method

Examples


Embodiment 1

[0044] as attached figure 2 As shown, the present embodiment provides a method for visualization of EEG data, comprising the following steps:

[0045] Step S10, processing and calculating the EEG data to obtain pseudo-color image data based on the energy intensity of the frequency band concerned;

[0046] Step S20, visual display, generating a first layer image related to the frequency domain based on the pseudo-color image data, and displaying the first layer image as a substrate superimposed on the second layer image; the second layer image The layer image is a time-domain image related to the energy intensity of the frequency band of interest.

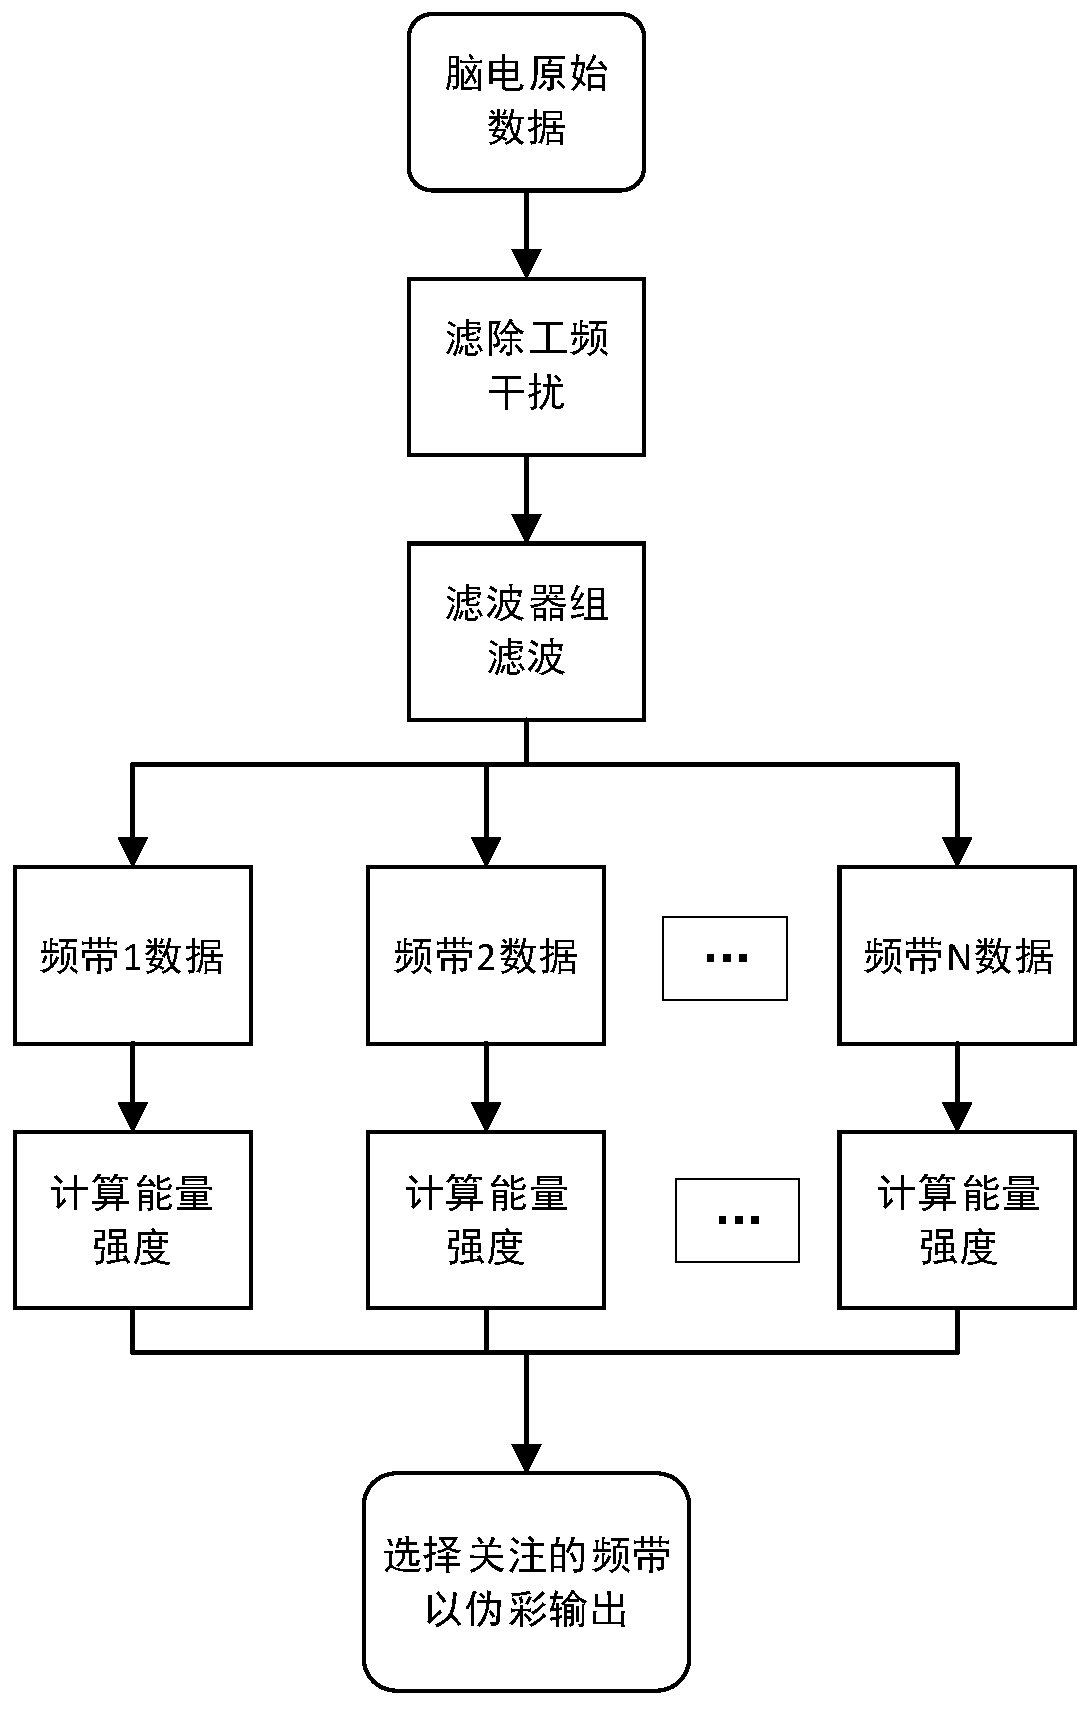
[0047] as attached image 3 As shown, the step S10 further includes the following steps:

[0048] In step S11, the collected raw EEG data is removed by a power frequency filter to remove 50 Hz / 60 Hz power frequency interference to obtain relatively pure EEG.

[0049] Step S12, extracting frequency domain features from the EEG r...

Embodiment 2

[0070] This embodiment provides an EEG device, including an EEG acquisition device, an EEG analysis device, and a display device.

[0071] The electroencephalogram collection device includes a plurality of leads and can collect the electroencephalogram signal of the user.

[0072] An EEG analysis device capable of visualizing the EEG signals at least partially according to the method in Embodiment 1 above.

[0073] The display device is used for displaying the image obtained after the visualization of the EEG signal.


PUM


Abstract

The invention provides an electroencephalogram time frequency information visualizing method. The method has the advantages that the part below the waveforms of video-information-superimposed electroencephalogram is displayed in a pseudo color, a doctor can monitor the pathological change of electroencephalogram only by observing color information which is easier to notice, and monitoring difficulty is lowered; due to the fact that frequency information which actually needs to be observed is the energy intensity of specific frequency bands, frequency information can be lowered two one dimension, only the energy sum of specific frequency bands is kept, lead, which is an extra dimension, is extended, and accordingly the doctor can observe a time frequency graph with the transverse axis being time and the longitudinal axis being lead position and using the pseudo color to display specific frequency band energy; meanwhile, high-frequency pathological wave information is displayed through the pseudo color, low-frequency physiological wave information is displayed through time domain waveforms, and accordingly the doctor can observe two information at the same time, and diagnosis is facilitated.

Description

technical field [0001] The invention relates to an electroencephalogram acquisition and analysis method, in particular to a visualization method capable of simultaneously observing the time-frequency information of all leads. Background technique [0002] In the process of collecting and analyzing the EEG, the frequency information of the EEG is very important. Since the EEG signal is a non-stationary signal, its frequency information will change with time, so it is called time-frequency information. In EEG analysis, it is often necessary to visualize the time-frequency information of the collected EEG to help doctors analyze the patient's EEG. Because the EEG of different frequencies will reflect different physiological or pathological information of patients or subjects, which plays a key role in the diagnosis and location of lesions. In the process of normal EEG waveform display, the human eye is often unable to find specific frequency information in as many as thousands...

Claims


Application Information

Patent Timeline
IPC IPC(8): A61B5/04A61B5/0476A61B5/00G16H30/40
CPCA61B5/0033A61B5/72A61B5/742A61B5/316A61B5/369G16H30/40
Inventor 胥红来黄肖山李昂
Owner NEURACLE TECH CHANGZHOU CO LTD
Why Eureka
Try Eureka