
Big data-based data visualization creation method

A big data and data technology, applied in the field of data visualization creation based on big data, can solve the problems of big data difficulty and low degree of data visualization, and achieve the effect of accurate understanding

Pending Publication Date: 2019-11-05
江苏中润普达信息技术有限公司
View PDF1 Cites 0 Cited by
  • Summary
  • Abstract
  • Description
  • Claims
  • Application Information

AI Technical Summary

Problems solved by technology

[0003] The purpose of the present invention is to solve the shortcomings in the prior art that big data is usually presented directly in an incomprehensible way, and the degree of data visualization is low, and proposes a data visualization creation method based on big data

Method used


Image

  • Big data-based data visualization creation method

Examples


Embodiment Construction

[0014] The following will clearly and completely describe the technical solutions in the embodiments of the present invention with reference to the accompanying drawings in the embodiments of the present invention. Obviously, the described embodiments are only some, not all, embodiments of the present invention.

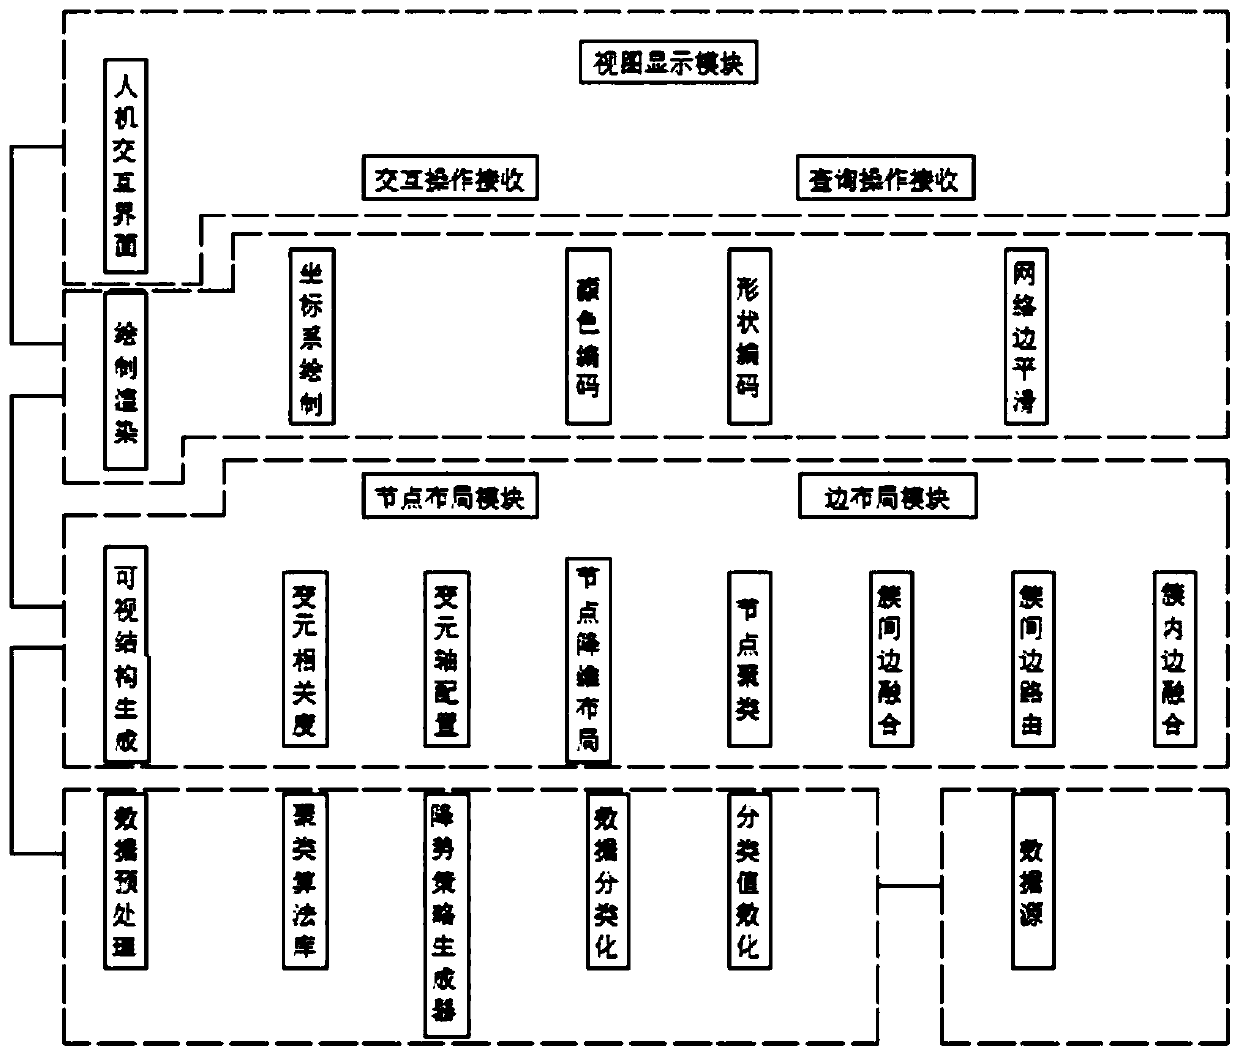
[0015] refer to figure 1 , a data visualization creation method based on big data, including the following steps:

[0016] S1. Data preprocessing step. Firstly, the multi-variable network data is manually entered into the data source. The data pre-processing module reads the multi-variable node data in the data source into the entire system, and converts the classification variables in the node table into Numeric variable;

[0017] S2. Visual structure generation step. The visual structure generation module is composed of two parts: node layout and edge layout. The node layout part inputs multi-variable node data of the same data type through the data acquisition in...


PUM


Abstract

The invention relates to the technical field of information and particularly relates to a big data-based data visualization creation method. The method comprises a preprocessing step, a visual structure generation step, a drawing and rendering step and a man-machine interaction step. A new way for analyzing multivariate network information data by using an information visualization technology is provided. Therefore, numerous and complex information analysis tasks can be realized through visual, vivid and clear visual views and simple and convenient man-machine interaction operation. The information analysts are assisted in comprehensively mastering the overall distribution structure of the information data set and the mutual relation between information content elements or information individuals. A technical foundation is laid for efficiently and accurately understanding information and revealing implicit information.

Description

technical field [0001] The invention relates to the field of information technology, in particular to a data visualization creation method based on big data. Background technique [0002] Nowadays, the management of cities by government departments tends to be intelligent and informatized. Through the comprehensive management of big data on urban operating signs, government departments have improved the efficiency and quality of their own urban management and urban services. However, the existing big data management platform for urban operation signs lacks in-depth mining and analysis of big data. Big data is usually presented directly in an incomprehensible way. Big data, thus reducing the research speed of urban management decision makers on big data. Contents of the invention [0003] The purpose of the present invention is to solve the shortcomings in the prior art that big data is usually directly presented in an incomprehensible manner, and the degree of data visua...

Claims


Application Information

Patent Timeline
Patent Type & Authority Applications(China)
IPC IPC(8): G06F16/26G06F16/27G06F3/01
CPCG06F16/26G06F16/27G06F3/011
Inventor 杜小军杜乐
Owner 江苏中润普达信息技术有限公司
Learn More