Supercharge Your Innovation With Domain-Expert AI Agents!

Traffic data visualization analysis method and device, equipment and readable storage medium

A technology of traffic data and analysis methods, which is applied in the field of data analysis and can solve problems such as the inability of decision makers to make quick decisions

Active Publication Date: 2019-11-15
WEBANK (CHINA)
View PDF5 Cites 1 Cited by
  • Summary
  • Abstract
  • Description
  • Claims
  • Application Information

AI Technical Summary

Problems solved by technology

[0004] The main purpose of the present invention is to provide a traffic data visualization analysis method, device, equipment and readable storage medium, aiming to solve the problem of only monitoring real-time traffic flow information, which cannot help decision makers make decisions quickly when abnormalities occur technical issues

Method used


Image

  • Traffic data visualization analysis method and device, equipment and readable storage medium
  • Traffic data visualization analysis method and device, equipment and readable storage medium
  • Traffic data visualization analysis method and device, equipment and readable storage medium

Examples


Embodiment approach

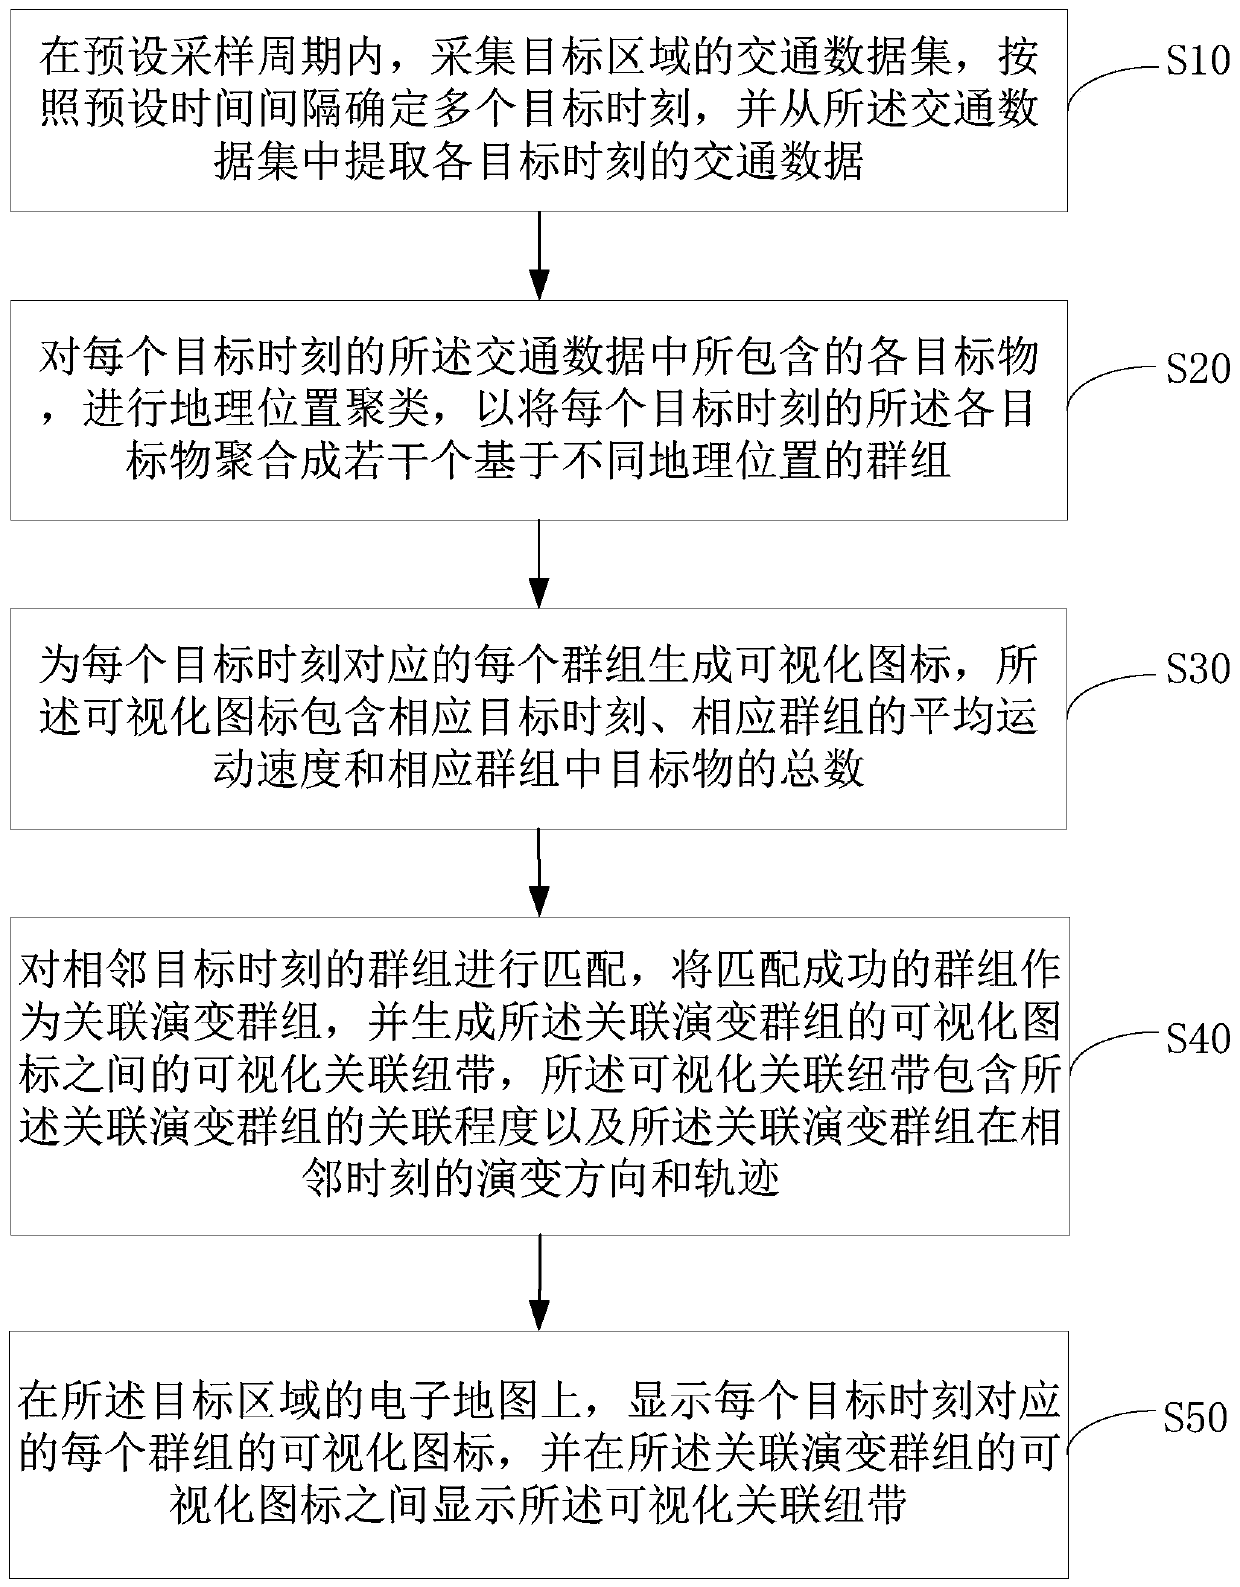
[0065] Further, each target object contained in the traffic data at each target moment is clustered by geographic location, so that each target object contained in the traffic data at each target moment is aggregated into several groups based on different geographic locations. group. As an implementation manner, the step S20 includes:

[0066] A. Obtain the geographic location of each target from the traffic data at each target moment;

[0067] B. According to the geographic location of the targets at each target moment, use a hybrid clustering algorithm to cluster the targets at each target moment, so as to aggregate the targets at each target moment into several geographically based groups.

[0068] That is, first obtain the corresponding geographic location of each target from the traffic data at each target moment. In order to improve the accuracy of the clustering results, a hybrid clustering algorithm is used according to the geographic location of each target at each ...


PUM


Abstract

The invention discloses a traffic data visualization analysis method and device, equipment and a readable storage medium, and the method comprises the steps: collecting a traffic data set of a targetregion in a preset sampling period, and extracting the traffic data of each target moment from the traffic data set; carrying out geographical position clustering on each target object in the trafficdata at each target moment so as to aggregate each target object at each target moment into a plurality of groups based on different geographical positions; generating a visual icon for each group ateach target moment; matching the groups at adjacent target moments, taking the successfully matched group as an associated evolution group, and generating a visual association link between the visualicons of the associated evolution group; and on the electronic map of the target area, displaying the visual icon of each group at each target moment, and displaying the visual association link between the visual icons of the associated evolution groups. According to the invention, a decision maker can be helped to make a decision quickly when abnormality occurs.

Description

technical field [0001] The invention relates to the field of data analysis, in particular to a traffic data visualization analysis method, device, equipment and readable storage medium. Background technique [0002] With the rapid increase of urban population, the traffic flow will increase significantly, especially in urban hot spots, or in the scene of large-scale marathon events, the traffic flow will increase sharply in a short period of time. At present, only the real-time traffic flow information (including vehicle speed, people or traffic flow, emergency alarm, etc.) Under the circumstances, decision makers need to spend more time and resources to make decisions. [0003] The above content is only used to assist in understanding the technical solution of the present invention, and does not mean that the above content is admitted as prior art. Contents of the invention [0004] The main purpose of the present invention is to provide a traffic data visualization ana...

Claims


Application Information

Patent Timeline
IPC IPC(8): G06Q10/06G06Q50/30
CPCG06Q10/06G06Q50/40
Inventor 林焕彬李权陈天健
Owner WEBANK (CHINA)
Features
  • R&D
  • Intellectual Property
  • Life Sciences
  • Materials
  • Tech Scout
  • Unparalleled Data Quality
  • Higher Quality Content
  • 60% Fewer Hallucinations
Learn More