
Data processing method for multi-dimensional titration analysis and application of data processing method

A technology for data processing and titration analysis, applied in the field of measurement and analytical chemometrics, which can solve problems such as systematic errors, baseline range drift, and inability to compare different experimental data.

Active Publication Date: 2019-12-31
王飞 +1
View PDF8 Cites 3 Cited by
  • Summary
  • Abstract
  • Description
  • Claims
  • Application Information

AI Technical Summary

Problems solved by technology

[0005] However, even for the simultaneous titration of the same sample, the measurement results of different titration methods cannot be directly compared with the measurement data. There are two essential problems that limit the simultaneous analysis of the measurement data: one is that the measurement sequence drift of different titration methods is different, When performing multi-dimensional simultaneous titration, there are systematic errors caused by reading errors in the measurement sequence reference; second, different titration methods have different sensitivities and detection limits, so the titration data of different titration parameters under the same coordinates will also have different results. However, there is a drift in the baseline range between different titration data baselines. Therefore, the same data correction method cannot be used in the data processing process, so that the real comparison of different experimental data cannot be achieved.

Method used


Image

  • Data processing method for multi-dimensional titration analysis and application of data processing method
  • Data processing method for multi-dimensional titration analysis and application of data processing method
  • Data processing method for multi-dimensional titration analysis and application of data processing method

Examples


Embodiment 1

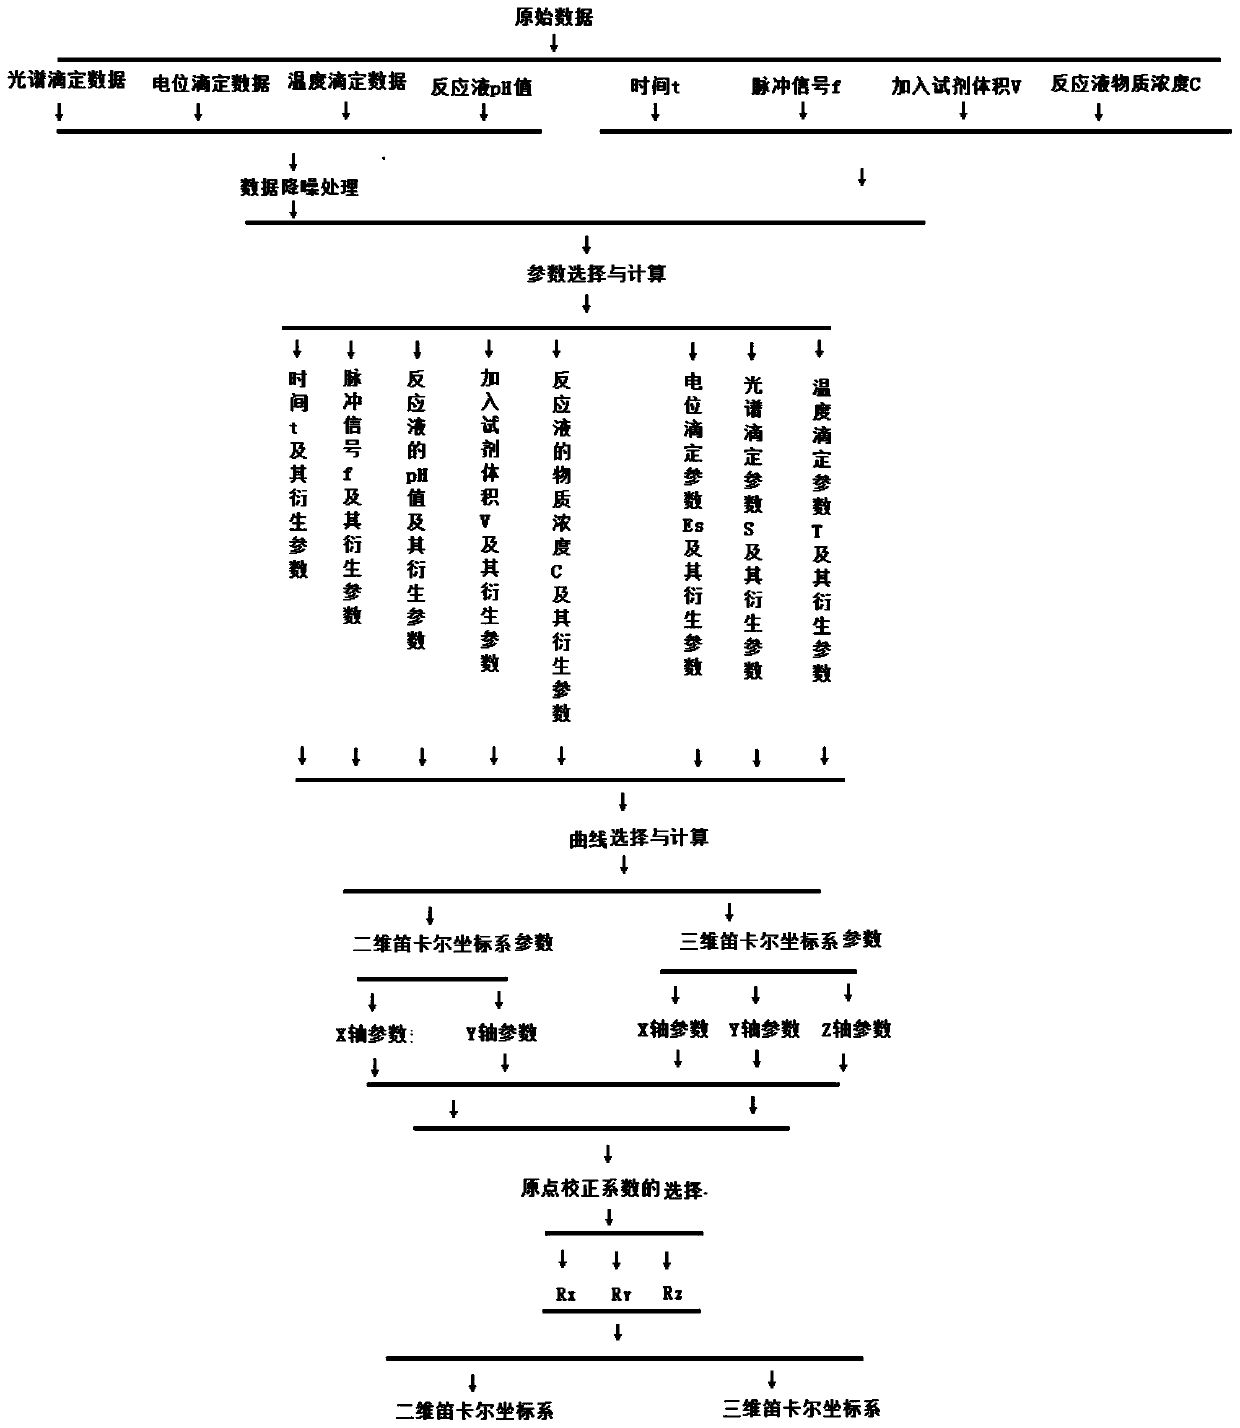
[0060] A data processing method for multidimensional titration analysis, comprising:

[0061] (1) Data collection: set and add reagent volume v as measurement sequence parameter, carry out the measurement of temperature titration mode, spectral titration mode, electrochemical titration mode synchronously of sample to be measured, obtain spectral titration data, potentiometric titration data and temperature titration data;

[0062] (II) First-level data processing: the spectral titration data, potentiometric titration data and temperature titration data of step (I) are subjected to noise reduction processing to obtain the first-time processing data, and use the first-time processing data and the added reagent volume v to construct the measurement sequence data 3 tables of raw titration data;

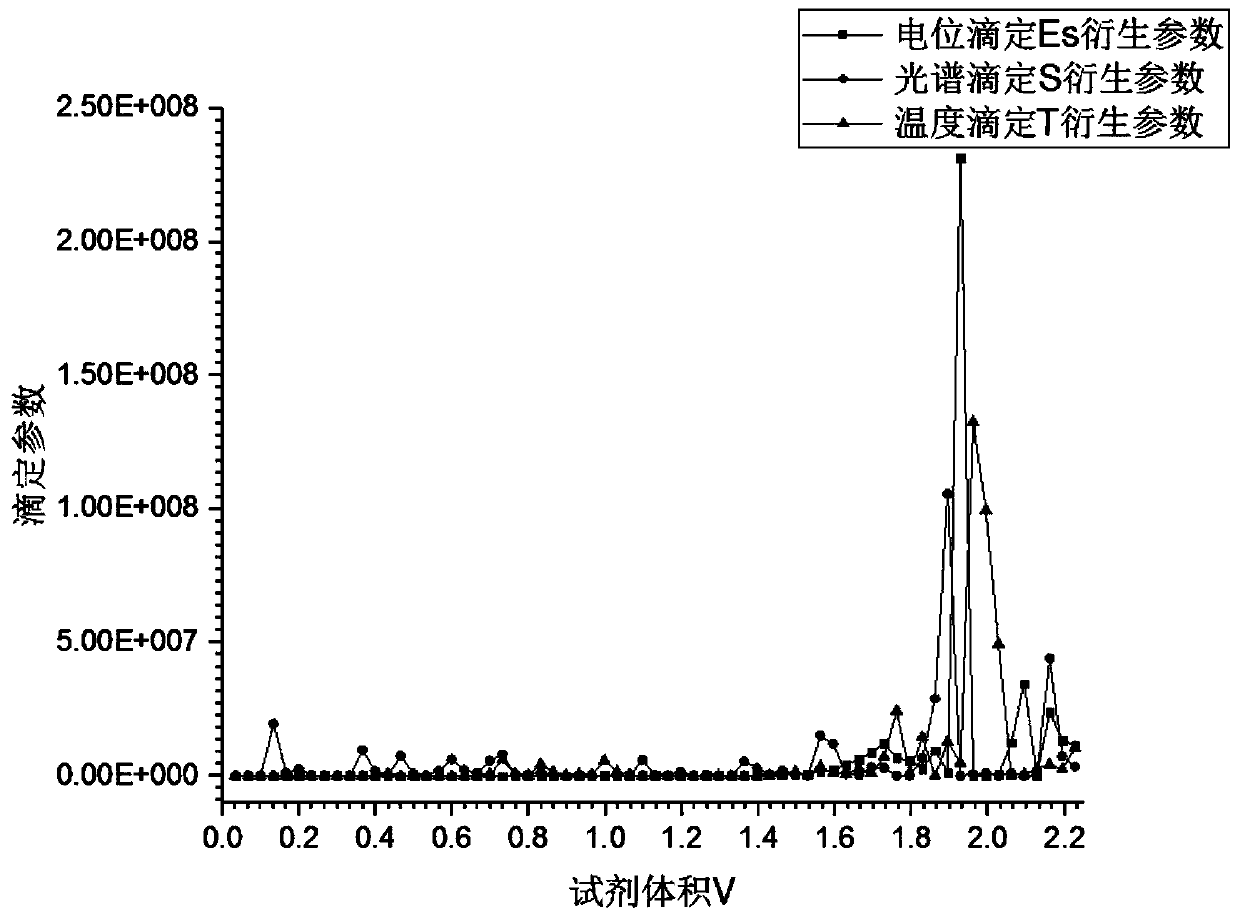
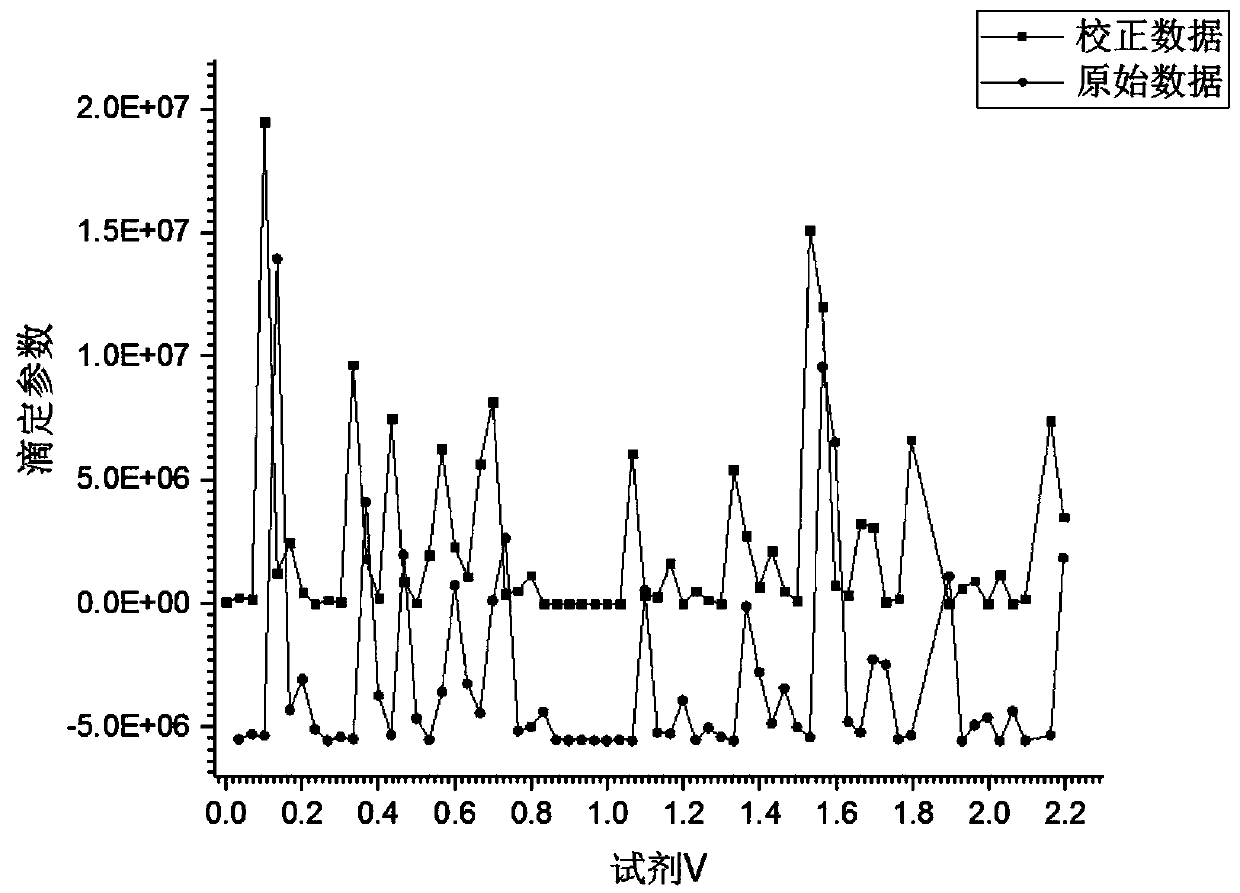
[0063] (III) Construct the original titration curve: use the original titration data table of step (II) respectively, take the added reagent volume v as the x-axis, and use the spectral t...

Embodiment 2

[0068] A kind of data processing method of multidimensional titration analysis, the difference with embodiment 1 is: the measurement sequence parameter in step (1) is replaced by the pH value of reaction solution, all the other steps are all the same as embodiment 1. The obtained spectrum-potential-temperature-pH value two-dimensional calibration titration curve is as follows Figure 4 shown.

Embodiment 3

[0070] A data processing method for multidimensional titration analysis, the difference from embodiment 1 is: the measurement sequence parameters in step (1) are replaced by pulse signal f, and all the other steps are the same as in embodiment 1. The obtained spectrum-potential-temperature-pulse two-dimensional calibration titration curve is as follows Figure 5 shown.


PUM


Abstract

The invention discloses a data processing method for multi-dimensional titration analysis. According to the method, one or more measurement sequence parameters are set, so that the measurement benchmark of the titration analysis is expanded; one or more titration parameters are set, so that the synchronous measurement of multiple titration methods can be realized; original titration curves are constructed through the titration data; on the basis of the drift correction of the measurement sequence and titration data, the multiple original titration curves are unified at the same original pointof the same coordinate system, so that a corrected titration curve is obtained; the comparison of the multiple original titration curves in the same coordinate system is achieved; and therefore, the synchronous analysis of the measurement data of the different titration methods and the comparative analysis of the different measurement data are achieved. Furthermore, the invention also discloses application of the data processing method for the multi-dimensional titration analysis to the substance structure characterization and measurement of reaction solutions. With the data processing methodapplied, the comparative analysis of measurement data in different test processes can be realized.

Description

technical field [0001] The invention belongs to the field of measurement technology, in particular to the field of analytical chemometrics, and more specifically to a data processing method for multidimensional titration analysis and its application. Background technique [0002] In titration chemical analysis, the change and measurement of the substance structure in the reaction solution is an extremely important basic work in chemical analysis. Using different measurement methods to obtain different measurement data for the same measurement target, and by comparing the data, it can provide analysis of different physical quantities for the change process of the material structure in the chemical reaction, which is widely used and extremely important in chemical analysis. link. [0003] At present, there are three main measurement techniques for titration analysis instruments used in chemical reactions, namely potentiometric titration, temperature titration and spectroscopi...

Claims


Application Information

Patent Timeline
Patent Type & Authority Applications(China)
IPC IPC(8): G01N31/16
CPCG01N31/16
Inventor 王飞钟亚莉李响黄学者王宇曦郭禹李婧奕
Owner 王飞
Learn More