Method and device for evaluating feature distribution and confidence of data

A technology of feature distribution and confidence, applied in data processing applications, acquisition/recognition of facial features, character and pattern recognition, etc., can solve the problems of reduced model accuracy, biased risk estimation, biased emotion classification, etc., to improve accuracy. reliability and reliability, increasing confidence, improving accuracy

Pending Publication Date: 2020-04-24
北京国腾联信科技有限公司
View PDF0 Cites 4 Cited by
  • Summary
  • Abstract
  • Description
  • Claims
  • Application Information

AI Technical Summary

Problems solved by technology

[0004] However, the current best estimate method will cause the single value of the feature data to lose the meaning of the feature data. For example, the image feature data indicating the type of emotion in the emotion classification model, the emotion classification score indicated by the image feature data obtained from data source A is 0.9 , the corresponding emotion is happy, the emotion classification score indicated by the image feature data obtained from data source B is 0.3, and the corresponding emotion is sadness. If the emotion classification score obtained by the best estimate method is 0.6, the corresponding emotion may be Bias classification of emotions for happiness or emotions other than happiness and sadness
Also for the financial risk prediction model, if there are two data sources with profit estimates of -5 million yuan and +7 million yuan respectively, and the risk policy requires that profits must be made, at this time, if the "best estimate method" is used to make a profit of 100 Therefore, the current best estimation method cannot reflect the differences between values ​​from different data sources, nor can it reflect the reliability of values ​​​​from different data sources, which leads to the accuracy of the model. reduced

Method used


Image

  • Method and device for evaluating feature distribution and confidence of data
  • Method and device for evaluating feature distribution and confidence of data
  • Method and device for evaluating feature distribution and confidence of data

Examples


Embodiment Construction

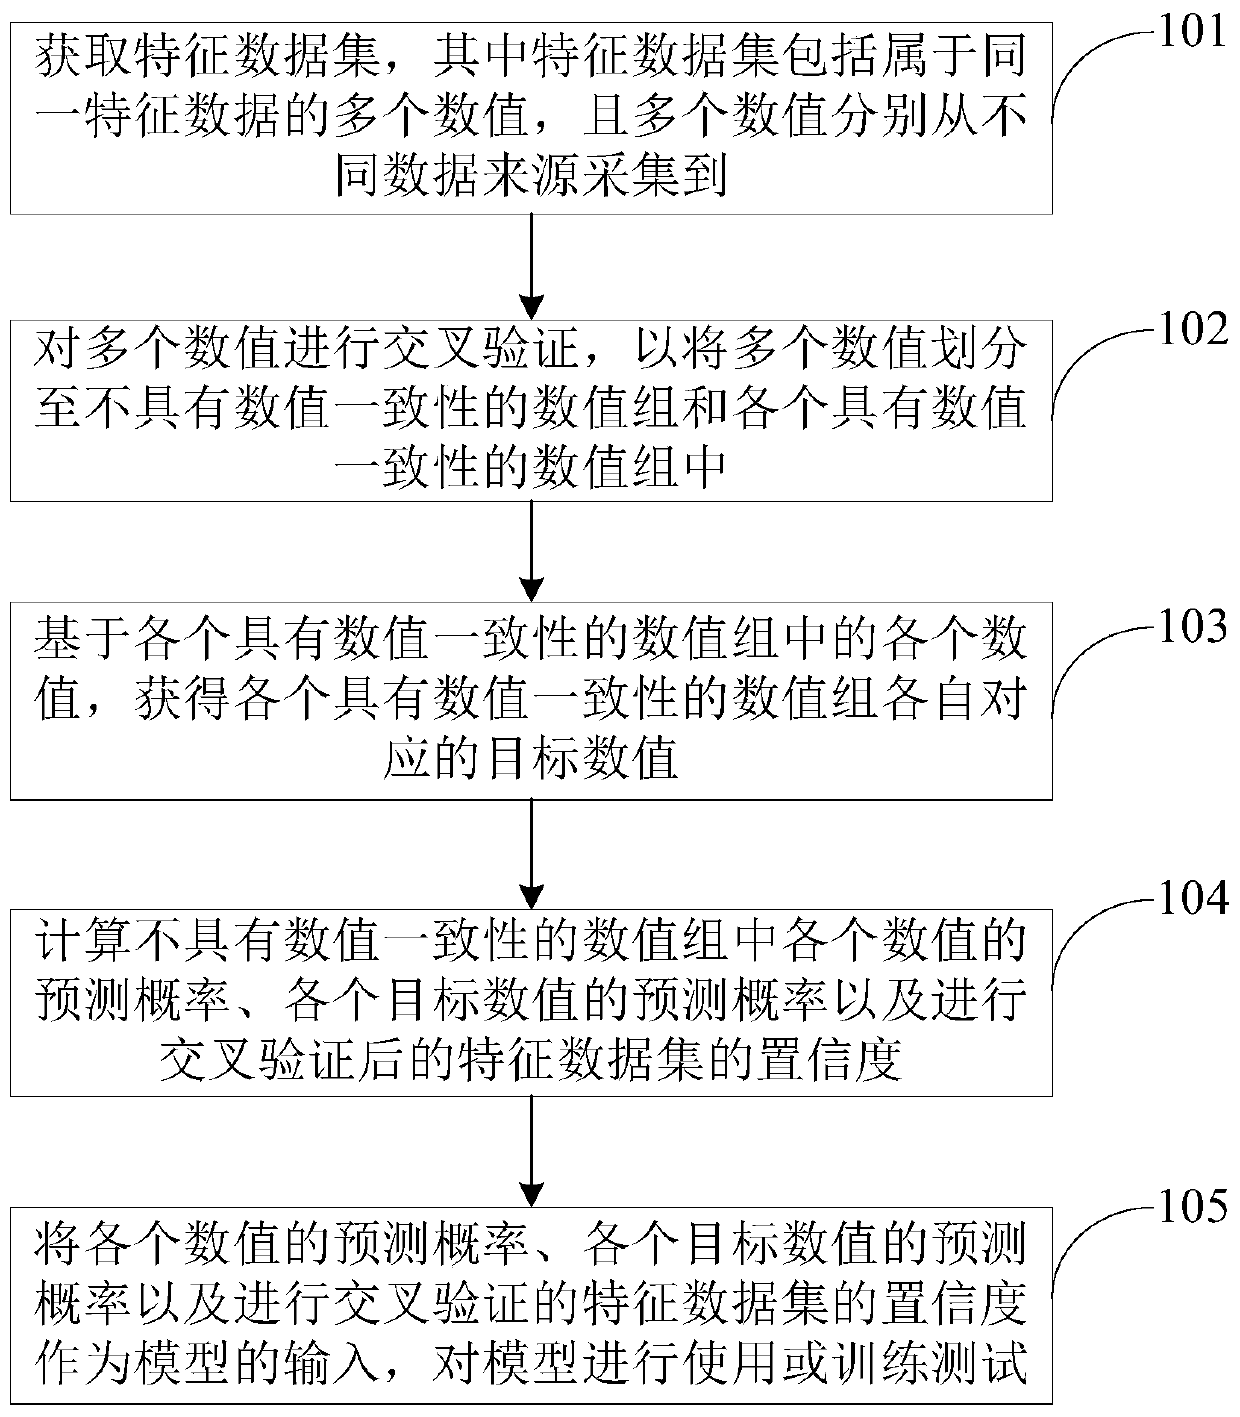
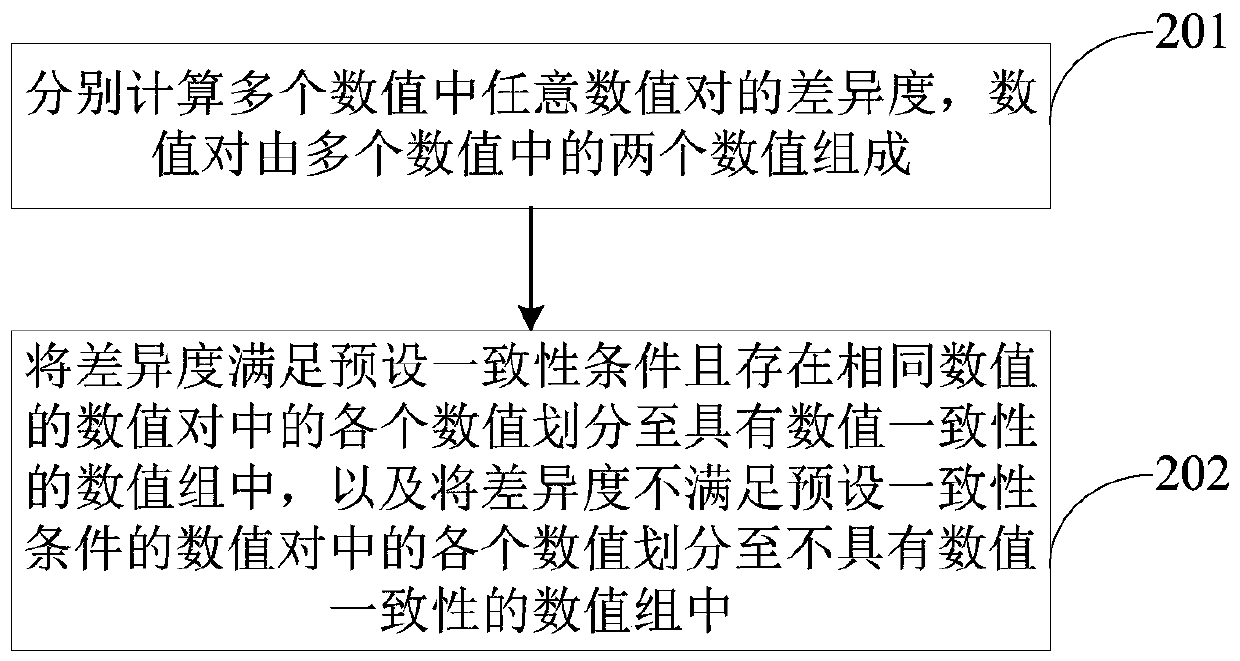
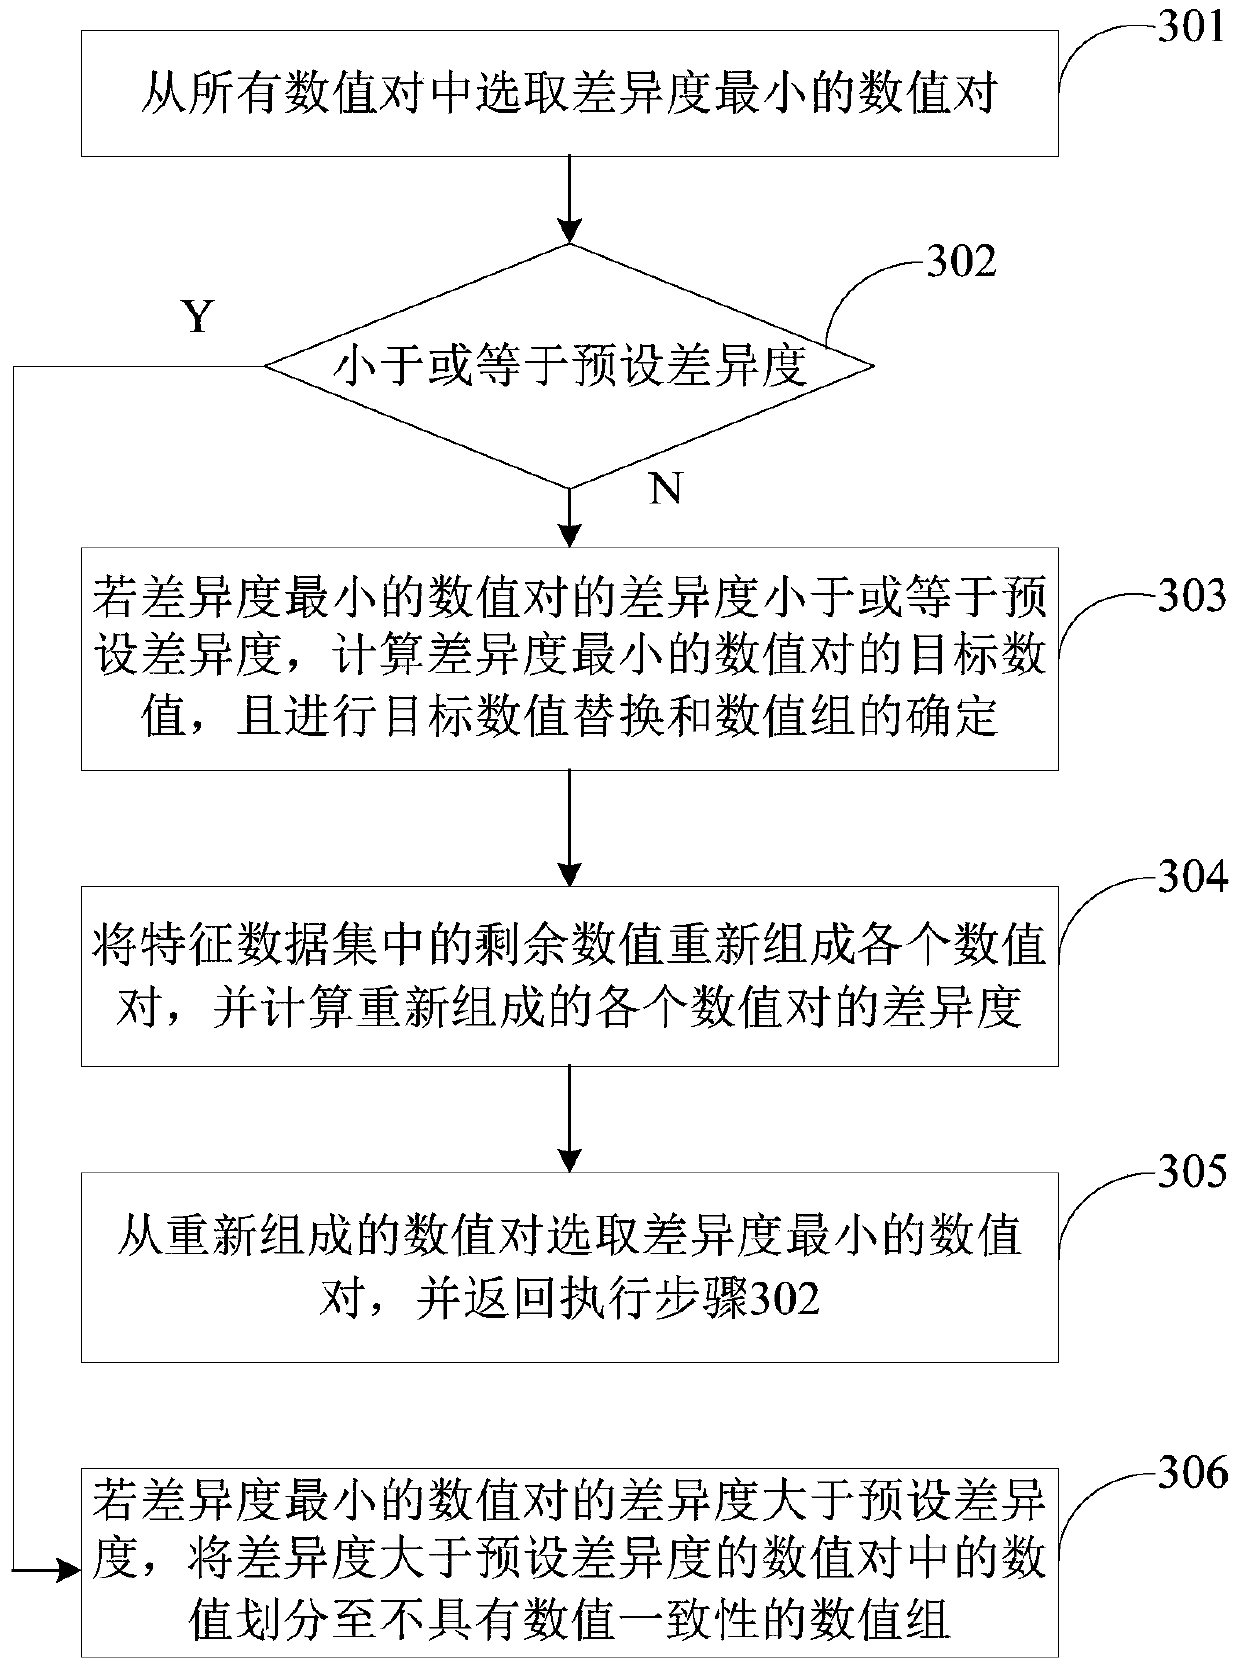
[0055] At present, the same characteristic data can be collected from different data sources. For these multiple values ​​belonging to the same characteristic data and collected from different data sources, a single value is calculated by the best estimation method, and the single value is used as a model. However, this method cannot reflect the difference between the values ​​collected from different data sources, and using a single value method will deviate from the actual value and reduce the accuracy of the model. The reason for reducing the accuracy is that a single value will lose accuracy. And the reliability of the values ​​collected from different data sources is different, which will be ignored by the best estimation method. For this reason, this embodiment uses the predicted probability of multiple values ​​belonging to the same feature data and the stored multiple values ​​of the feature data. The confidence of the numerical feature data set (that is, the confidence...


PUM


Abstract

The invention provides a method and a device for evaluating feature distribution and confidence of data. The method comprises the steps of obtaining a feature data set; performing cross validation ona plurality of numerical values which belong to the same feature data in the feature data set and are from different data sources; dividing the plurality of numerical values into a numerical value group without numerical value consistency and each numerical value group with numerical value consistency; obtaining a target numerical value corresponding to each numerical value group with numerical value consistency; calculating the prediction probability of each numerical value in the numerical value group without numerical value consistency, the prediction probability of each target numerical value and the confidence coefficient of the feature data set after cross validation; and using or training the model as input of the model so as to replace a single value obtained in an existing optimalestimation value mode through prediction probability distribution of numerical values of the same feature data and confidence of a feature data set, thereby embodying difference between the numericalvalues and improving accuracy of the model.

Description

technical field [0001] The invention belongs to the technical field of machine learning models, and in particular relates to a method and a device for evaluating feature distribution and confidence of data. Background technique [0002] At present, some meaningful feature data needs to be collected in the process of building a machine learning model. For example, the sentiment classification model needs to collect the feature data indicating the emotion category, and the financial risk prediction model needs to collect the feature data indicating the financial risk, such as customer income and liabilities. and many more. [0003] In the era of big data, data is growing explosively, and the same feature data may have multiple data sources. For the same feature data from multiple data sources, the feature data is evaluated by the best estimate method during the establishment of the machine learning model. The processing yields a single value, which is then used as an input to...

Claims


Application Information

Patent Timeline
Patent Type & Authority Applications(China)
IPC IPC(8): G06N20/00G06K9/00G06K9/62G06Q40/02
CPCG06N20/00G06Q40/02G06V40/174G06F18/214
Inventor 史岩张君强晓雯菅鹏李卓夏珣殷朋朋武哲吕春明谭世鹏仲崇龙
Owner 北京国腾联信科技有限公司
Why Eureka
Try Eureka