Method for calculating traffic capacity of left-turn lane under left-turn allowable phase
A technology of traffic capacity and left-turn lane, which is used in traffic control systems of road vehicles, traffic flow detection, traffic control systems, etc.
Inactive Publication Date: 2020-05-12
JILIN UNIV
5 Cites 0 Cited by
AI-Extracted Technical Summary
Problems solved by technology
This method is different from the idea that the number of crossing vehicles depends on the size of the gap in the traditional gap theory. It can avoid the problem that the traffic environment assumption is too ideal...
Abstract
The invention provides a method for calculating the traffic capacity of a left-turn lane under a left-turn allowable phase. The method comprises the following steps of: step 1, collecting basic data;2, calculating the maximum passing vehicle number GpL (pcu) of a left-turn release unit of an intersection; 3, calculating the time t1 (s) of a green light initial stage; 4, calculating the time t2 (s) of a non-green-light initial stage; 5, calculating the traffic capacity CAP1 (pcu/h) of a left-turn lane at the green light initial stage; 6, calculating the traffic capacity CAP2 (pcu/h) of the left-turn lane in the non-green-light initial stage; and step 7, calculating the sum CAPL (pcu/h) of the traffic capacity of the left-turn lane in a whole signal period. According to the method, the mutual influence between left-turn traffic flow and opposite traffic flow under the left-turn allowable phase is considered, so that the traffic capacity of left-turn vehicles at the intersection of the left-turn allowable phase can be calculated more accurately; and domestic data are adopted in a modeling process, so that the method is more suitable for the actual situation of a domestic intersection.
Application Domain
Controlling traffic signalsDetection of traffic movement
Technology Topic
Traffic capacityReal-time computing +2
Image
Examples
- Experimental program(1)
Example Embodiment
[0115] The technical solutions in the embodiments of the present invention will be described clearly and completely below. Obviously, the described embodiments are only a part of the embodiments of the present invention, rather than all the embodiments. Based on the embodiments of the present invention, all other embodiments obtained by those of ordinary skill in the art without creative work shall fall within the protection scope of the present invention.
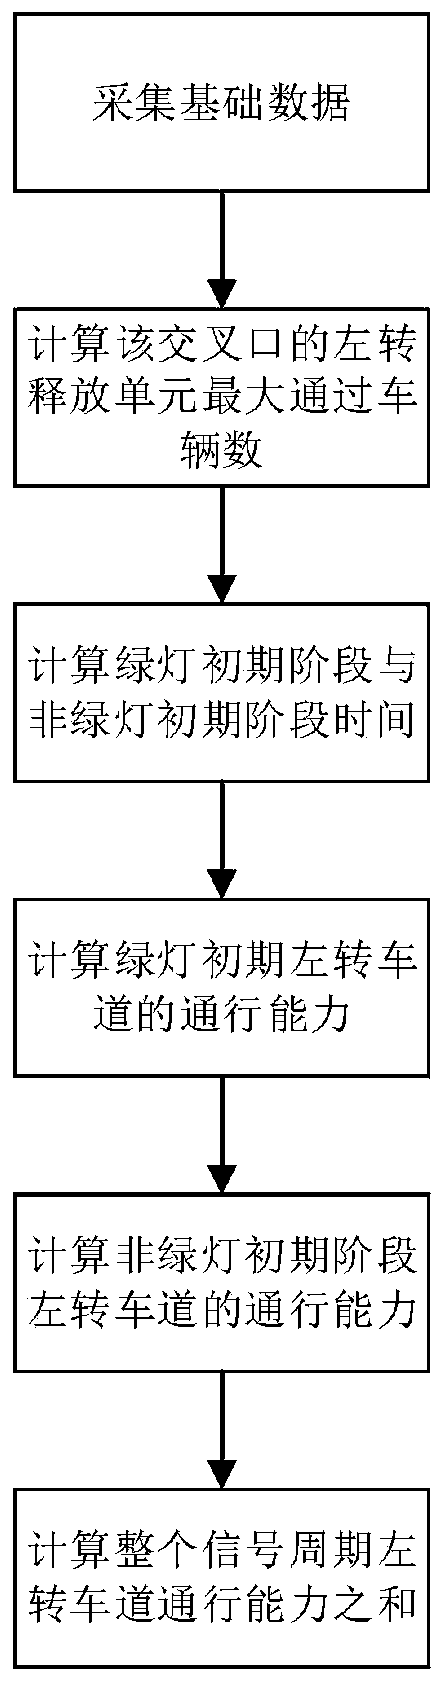
[0116] Method for calculating left-turn lane traffic capacity under left-turn permission phase
[0117] Step 1: Collect basic data
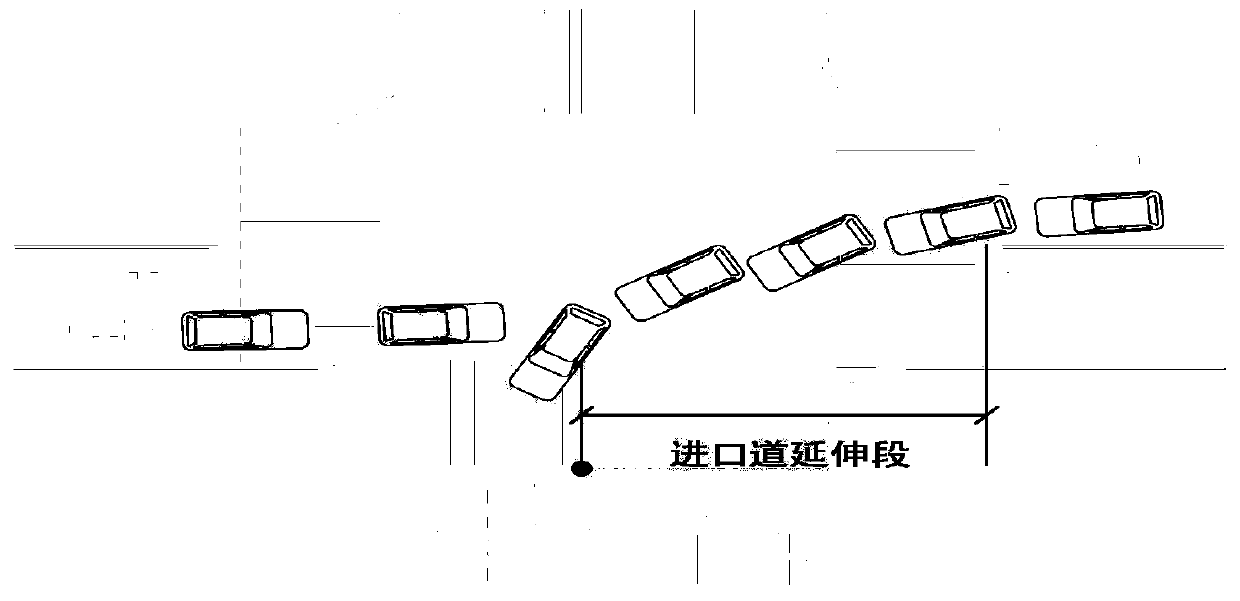
[0118] (1) Measure the length L of the extension of the entrance road at the intersection where the capacity is to be calculated ex (m)
[0119] Length of entrance extension section L ex It refers to the distance from the left-turn stop line to the left-turn exit lane on the opposite roadway separation line, such as figure 1 Shown:
[0120] (2) Collect the signal control cycle length C(S) of the intersection to be investigated, that is, calculate the sum of the time required for all traffic signal phases to display one week.
[0121] (3) Investigate the mean time interval occupied by car following cars turning left That is, to investigate the mean value of the time difference between the left front wheel of the two left-turning cars before and after the intersection to reach the boundary line of the straight lane and the extension line within the intersection.
[0122] (4) Investigate the additional time when the left turn release unit passes through the intersection Additional time when the left turn release unit passes at the intersection Including the length of time it takes the leading vehicle to turn left to the potential conflict point, the length of time the vehicle at the end of the left-turn release unit occupies the opposite straight lane, etc.
[0123] (5) Generally, the critical clearance of the leading left-turning vehicle is 3.6s.
[0124] Step 2: Calculate the maximum number of passing vehicles Gp of the left-turn release unit at the intersection L (pcu)
[0125] Gp L = <4.5lnL ex -6.8> Formula 1)
[0126] Where: L ex Is the length of the extension (m); Gp L Is the maximum number of vehicles passing through a left-turn release unit (pcu), Gp L Take the nearest integer.
[0127] Step 3: Calculate the time t at the initial stage of the green light 1 (s)
[0128]
[0129] Where: Gp L Is the maximum number of vehicles passing through a left-turn release unit; The mean value (s) of the encroachment time of left-turn car-following cars can be obtained from the expectation of the Log-logistic encroachment time distribution model in Section 2.4; It is the additional time (s) for the passage of the left-turn release unit, including the time it takes for the leading vehicle to turn left to the potential conflict point, and the length of time the vehicle at the end of the left-turn release unit occupies the opposite straight lane.
[0130] Step 4: Calculate the non-green light initial stage time t 2 (s)
[0131]
[0132] Where: t 2 Is the duration of the initial phase of the non-green light (s); g is the duration of the green light phase (s); I is the green light interval (s).
[0133] Step 5: Calculate the capacity CAP of the left-turn lane at the beginning of the green light 1 (pcu/h)
[0134]
[0135] Where: CAP 1 Is the capacity of the left-turn lane at the beginning of the green light (pcu/h); C is the signal period (s); Gp L It is the maximum number of vehicles passing through a left-turn release unit (pcu).
[0136] Step 6: Calculate the capacity CAP of the left-turn lane at the initial stage of non-green light 2 Details include
[0137] (1) Calculate the number of gaps n under the condition of m right-turning cars gap
[0138] Since in the non-green light initial phase, the traversable clearance for left-turning vehicles is provided by right-turning vehicles appearing in the opposite straight-right lane, the capacity of the left-turning lane is closely related to the number of right-turning vehicles in the oncoming traffic. . The key to calculating the capacity is to calculate the number of gaps that a right-turning vehicle can provide. First you should get the N arriving in the opposite straight right lane T+R The probability that there are m right-turning cars in the car; then calculate the number of gaps that these m right-turning cars can provide. Below, these two steps are discussed in detail.
[0139] 1) Probability of m right-turning cars
[0140] At the entrance of the intersection, the traffic flow density is high, the traffic flow runs in a saturated state, and the lane changing behavior is restricted. The arrival of right-turning vehicles should obey the Bernoulli distribution, so the proportion of right-turning is p R Under the conditions of time period t, the opposing entrance road will saturate the headway N arrived T+R Among the straight and right-turning vehicles, the probability P(N R =m) is
[0141]
[0142] Once the gap in the through-travel traffic is greater than the transit time of a left-turn release unit, the second left-turn release unit will pass immediately. In order to facilitate subsequent calculations, t can be the length of time that a left-turn release unit occupies the opposite straight lane, as shown in equation (6).
[0143]
[0144] Take t and saturated headway The ratio is rounded to the nearest integer to get N T+R , As shown in formula (7).
[0145]
[0146] 2) The number of gaps that m right-turning vehicles can provide
[0147] m and N T+R The different quantity relationship between the m vehicles will provide the number of gaps n gap Has different effects. Next, we will take N for m T+R , 0, 1, 2 and N in 6 cases gap Values are discussed and analyzed.
[0148] ①m=N T+R
[0149] The vehicles arriving in the t time period are all right-turning vehicles. Since in the formula, the right-turn traffic arrival distribution is calculated based on the length of time a left-turn release unit occupies the opposite straight lane, so the left-turn lane can only pass through one left-turn release unit during the t time period. n gap The expectation is
[0150]
[0151] ②m=0
[0152] At this time, there is no right-turning vehicle in the oncoming straight traffic flow, and there is no available crossing gap, and the left-turn release unit cannot pass through the intersection. n gap The expectation is
[0153]
[0154] ③m=1
[0155] At this time, there is only one right-turning car in the oncoming through traffic flow. Generally, the critical clearance of the leading vehicle turning left is 3.6s. When there is only one right-turning vehicle in the through traffic flow, it is possible that the sum of the headway time between it and the front and rear two through vehicles is less than 3.6s, and the clearance provided by it does not necessarily meet the requirements of the critical clearance. At this time, it is also necessary to discuss the distribution of the headway h of the front and rear two straight cars separated by a right-turning car. Use Weibull distribution as shown in formula (25) and formula (26) to express the distribution of headway.
[0156]
[0157]
[0158] According to formula (27), we can get h> by further calculation The probability of 3.6s is 0.7025.
[0159] P(h≥3.6)=1-F(3.6)=0.7025 formula (33)
[0160] Therefore, when m=1, the expected value of the amount of clearance that a right-turning car can provide is
[0161]
[0162] ④m=2
[0163] This situation is special and needs to be discussed separately. According to m and N T+R The difference in the quantitative relationship between the two should be divided into two cases.
[0164] (i)
[0165] That is, there are more right-turning cars and fewer straight-going cars. At this time, N T+R Only possible to take 3, so it can be directly obtained
[0166] (ii)
[0167] That is, there are fewer right-turning cars and more straight-going cars. If the two right-turning vehicles are divided into one group, the gap must be used; if the two right-turning vehicles are divided into two groups, it is also necessary to determine whether the provided gap meets the critical gap. Therefore, there is
[0168]
[0169] Where: Expect the number of clearances that m right-turn vehicles can provide; The number of gaps that can be used for a single right-turn car.
[0170] ⑤
[0171] In this case, the volume of right-turn traffic is less than the volume of straight traffic. These m right-turning vehicles can be interspersed in the through traffic flow in different combinations, and each group of right-turning vehicles may bring an opportunity for the opposite left-turning vehicle to pass. Therefore, it is necessary to determine the number of gaps that can be generated based on the different combinations of the m right-turning vehicles.
[0172] For m right-turning cars, they can be divided into 1 group, 2 groups...n groups...m groups, then it can be calculated that m cars are divided into n gap Group probability P(n gap )for
[0173]
[0174] Since the fundamental parameter that determines whether left-turn traffic passes is still the critical gap, for this n gap For groups of right-turning vehicles, whether each group can provide usable clearance needs further discussion.
[0175] Assume that the gap produced by this group of vehicles is a critical value of 3.6s. If there are more than two right-turning vehicles in a group, then the average headway time in the traffic flow formed by this group of vehicles and the two front and rear straight vehicles will reach 1.2s, which is unrealistic. Therefore, it can be considered that the gap provided by a group of more than two right-turning vehicles can be used by the left-turning release unit. When there is only one right-turning car in a certain group, the distribution of headway time needs to be discussed.
[0176] Next, discuss n gap In the group When there is only one car in the group. n gap Changes in the quantitative relationship with m will affect Calculation method, so this section will discuss n gap =1, n gap =m and 1 gap Calculation method. The sum of the probability in the three cases and the available gap provided by each case is As shown in formula (37).
[0177]
[0178] Where: The probability of occurrence and the expectation that the gap can be used under this condition; The probability of occurrence and the expectation that the gap can be used under this condition; P(n gap ) Is n gap Take the probability at 2~m-1, N gap There is an expectation of the number of available gaps when there is a right-turning car independently forming a group in each gap; N gap There is no expectation of the number of available gaps when a right-turning car is grouped independently in each gap.
[0179] The following three situations are discussed separately:
[0180] ①If n gap =1, because m>1, there is no situation where there is only one car in a certain group. The probability of its appearance is
[0181]
[0182] The number of clearances that this group of right-turning vehicles can provide is 1, that is
[0183]
[0184] ②If n gap =m, then There is only one right-turning car in each group. The probability of this happening is
[0185]
[0186] Whether the gap can be used also needs to determine whether the headway meets the requirements of the critical gap. Suppose the number of groups that can be used in the gap is The probability of its appearance is
[0187]
[0188] Then, the number of available gaps that these m groups can produce is expected for
[0189]
[0190] which is
[0191]
[0192] ③If 1 gap
[0193] In this case, divide m right-turning cars into n gap The probability of the group is
[0194]
[0195] The number of right-turning vehicles in each group also needs to be divided into existence There are only one right-turn car in the group and more than one right-turn car in each group.
[0196] (i) exist Group has only 1 right turn car
[0197] When calculating the probability, you can first extract n from m cars gap 1 vehicle per group, then select There is only one car in the group, and the remaining m-n gap Car to the remaining Group. Then, appear in the n groups The probability that the group has only one car is
[0198]
[0199] Since it is necessary to ensure that the remaining groups can be assigned to vehicles, there are
[0200]
[0201] Organize available
[0202]
[0203] According to the above analysis, in this n gap Group of vehicles turning right, the rest The gaps generated by the groups with more than 1 vehicles are all available, so the number of gaps provided by this part of the vehicles is
[0204] And for the rest Whether the gap generated by a group with 1 vehicle can be used, it is still necessary to determine whether the headway meets the requirements of the critical gap. Let the number of groups available for the gap in this case be The probability of occurrence is
[0205]
[0206] Then, Expected number of available gaps that can be generated by each group for
[0207]
[0208] In this way, n gap When there is a single vehicle in the group, the expected number of available gaps that the right-turning vehicle can provide for
[0209]
[0210] (ii) There is no single right-turn car as a group
[0211] At this time, each group has more than one right-turning car, and the probability of occurrence is Can be expressed as
[0212]
[0213] Where: This is the number of groups that can be divided into groups without a single right-turning car being a group.
[0214] Each group here can provide an available plug-in gap, so the expectation of the plug-in gap is
[0215]
[0216] To sum up, divide m vehicles into n gap After the group, the number of gaps that can be inserted into the car is expected to be the expected sum of the number of gaps available under the two conditions of the presence and absence of a right-turn car alone in a group, namely
[0217] In summary, substituting formula (36), formula (38), formula (39), formula (40), formula (43), formula (44), and formula (51) into formula (37), you can Get in When, the number of available gaps provided by m right-turn vehicles The expression of is shown in equation (52).
[0218]
[0219] ⑥
[0220] In this case, the volume of right-turn traffic is greater than the volume of straight-going traffic. The m right-turning cars can only be divided into N at most T+R -m group, n does not exist gap = In the case of m, n gap gap Group probability P(n gap ) Becomes
[0221]
[0222] Similarly, we need to discuss n gap In the group When there is only one car in the group. Due to n gap gap = 1 and 1 gap Calculation method. The sum of the probabilities in the two cases and the available gap provided by each case is As shown in the formula.
[0223]
[0224] Where: N gap =1 The probability of occurrence and the expectation that the gap can be used under this condition; P(n gap ) Is n gap Take 2~N T+R -m probability, N gap There is an expectation of the number of available gaps when there is a right-turning car independently forming a group in each gap; N gap There is no expectation of the number of available gaps when a right-turning car is grouped independently in each gap.
[0225] The following three situations are discussed separately:
[0226] ①If n gap =1, because m>1, there is no situation where there is only one car in a certain group. The probability of its appearance is
[0227]
[0228] The number of clearances that this group of right-turning vehicles can provide is 1, that is
[0229]
[0230] ②If 1 gap gap The probability of each group is
[0231]
[0232] Similarly, the number of right-turning vehicles in each group needs to be divided into existing There are only one right-turn car in each group and more than one right-turn car in each group. Same as category ③ in case (5), can be obtained, exist When there is only 1 right-turn car in each group, it appears in n groups The probability that the group has only one car is
[0233]
[0234] Expectation of the number of available gaps that a right-turning vehicle can provide for
[0235]
[0236] among them:
[0237]
[0238] When there is more than one right-turning car in each group, its probability of occurrence for
[0239]
[0240] Expectation of available gap for
[0241]
[0242] Substituting formula (39), formula (49), formula (53), formula (55) and formula (57) into formula (37), the number of usable gaps that m right-turn cars can provide The expression of, as shown in the formula.
[0243]
[0244] In summary, m takes N T+R , 0, 1, 2, and In 6 cases, the number of gaps that can be traversed for the left-turn release unit provided by the opposite straight lane Can be expressed as
[0245]
[0246] among them:
[0247]
[0248] (2) Calculate the time required to release all the m right-turning vehicles that arrived
[0249] By formula
[0250]
[0251] Calculate the time required to release all the m right-turning vehicles that arrived
[0252] Where: Is the number of gaps that can be inserted; Gp L Is the maximum number of vehicles passing through a left-turn release unit; It is the mean time interval occupied by car following cars turning left (s); It is the additional time (s) for the passage of the left-turn release unit, including the time it takes for the leading vehicle to turn to the potential conflict point, and the time for the vehicle at the end of the left-turn release unit to occupy the opposite straight lane; t T Is the mean value of headway of straight vehicles (s); t add T It is the additional time (s) when passing through vehicles, including the length of time for the head vehicle of the through convoy to travel to the potential conflict point, and the time required for the vehicle at the end of the through convoy to leave the potential conflict point, etc. The duration of the non-green initial stage is long as t 2 , If the signal control period C is taken into account, then the capacity CAP of the left-turn lane at the initial stage of the non-green light under the condition of m vehicles turning right 2_m Can be expressed as
[0253]
[0254] Arrived N T+R Among vehicles going straight and turning right, the number of vehicles turning right can be 0~N T+R. Consider the probability P(N R =m), the ratio of turning right is p R Under the conditions of non-green light, the capacity at the initial stage can be expressed as
[0255]
[0256] which is
[0257]
[0258] Step 7: Calculate the sum CAP of the left-turn lane capacity in the two phases L
[0259] Capacity CAP of left-turn lane L Is the sum of the capacity of the two stages, namely
[0260] CAP L =CAP 1 +CAP 2 Formula (12)
[0261] Substituting formula (4) and formula (11), we can get
[0262]
[0263] In order to verify the technical effect of the method, the calculated value of the model, the theoretical calculated value of the gap, the calculated value of the stop line section method and the actual value were compared and analyzed. In this invention, in order to obtain a capacity closer to the actual situation, the group with the largest sum of the number of left-turn vehicles passing through the left-turn permitted phase during two consecutive cycles during the peak period is selected and converted into hourly traffic. The value obtained later is used as the actual measured capacity.
[0264] For the gap theoretical model, since the number of left-turning vehicles crossing is strictly affected by the size of the oncoming traffic gap, the capacity calculated by it is much smaller than the actual observation value, which clearly illustrates the traffic obtained by this method. Ability is not accurate. However, in the stop line section method, because it is considered that the vehicle has passed the intersection when passing the stop line, most of the calculation results are much higher than the actual observation value, which cannot be achieved in practice.
[0265] The present invention considers the mutual influence between the left-turn traffic flow and the oncoming traffic flow in the left-turn permission phase, and can more accurately calculate the left-turn vehicle capacity at the left-turn permission phase intersection, and the domestic model is used in the modeling process. The data is more in line with the actual situation of domestic intersections.
[0266] For the traffic capacity model proposed in this paper, the input parameter values are obtained according to the actual road conditions survey, and the algorithm is programmed to solve the problem through the Matlab platform. The parameter values and capacity calculation results of each verified intersection are shown in Table 1.
[0267] Table 1 Value table of calculation parameters for verifying intersection capacity
[0268]
[0269]
[0270] When verifying the effect of the present invention, the gap theory model and the stop line section method, which are widely used in China, are selected for comparison with the calculation method in this paper. If the predicted value matches the observed value, then the data points will fall on the ideal curve y=x. Because in actual road conditions, there will always be interference from some other factors, the left-turn lane generally does not reach the theoretically calculated capacity, and it is normal that the theoretically calculated value is greater than the actual observed value.
[0271] by image 3 It can be seen that the correlation coefficient between the observed value and the predicted value is 0.81, showing a high degree of positive correlation. The coefficient of determination R2 of the linear regression of the data points is 0.84, and the linear relationship is significant. The intercept of the regression line is 77.30, which is slightly higher than the ideal curve y=x, indicating that the predicted value is close to and slightly higher than the observed value. The predicted value of capacity is not difficult to match in practice. In summary, the calculation results of the left-turn lane capacity model proposed in this paper are closer to the actual situation, and the prediction effect is better than existing methods.
[0272] Reference attached figure 2 , The specific implementation example is as follows:
[0273] Taking the east-west entrance road at the intersection of Tongzhi Street and Zhonghua Road as an example, the specific implementation scheme of the present invention is introduced.
[0274] 1. The intersection is measured on the spot
[0275] (1) Length of the extension section of the entrance passage in the east-west direction L ex =16m
[0276] (2) The signal control cycle length C=133s, the green light phase duration g=45s, and the green light interval time I=5s.
[0277] (3) Mean time interval occupied by car following cars turning left
[0278] (4) Additional time when the left turn release unit passes
[0279] (5) Critical gap t c =3.6s, saturated headway
[0280] 2. Calculate the maximum number of passing vehicles Gp of the left-turn release unit at the intersection from equation (1) L for
[0281] Gp L = <4.5ln16-6.8> = 5.68pcu
[0282] 3. Calculate the time t in the initial stage of the green light by formula (2) 1 for
[0283] t 1 =5.68×1.9+3.0=13s
[0284] 4. Calculate the non-green light initial stage time t by formula (3) 2 for
[0285] t 2 =45-13+5=37s
[0286] 5. Calculate the capacity CAP of the left-turn lane at the beginning of the green light from equation (4) 1 for
[0287]
[0288] 6. Calculate the capacity CAP of the left-turn lane at the initial stage of non-green light 2
[0289] According to the method described in step 6, calculate the CAP 2 =108pcu/h
[0290] 7. Calculate the sum of the capacity of the left-turn lane in the two stages, CAP L
[0291] CAP L =CAP 1 +CAP 2 =154+108=262pcu/h
[0292] The present invention considers the anti-traffic behavior of left-turning vehicles and proposes the concept of a left-turn release unit. Each traversable gap can pass through a left-turn release unit.
[0293] The present invention considers the mutual influence between the left-turn traffic flow and the oncoming traffic flow in the left-turn permission phase, and can more accurately calculate the left-turn vehicle capacity at the left-turn permission phase intersection, and the domestic model is used in the modeling process. The data is more in line with the actual situation of domestic intersections.
[0294] The above descriptions are only preferred embodiments of the present invention and are not intended to limit the present invention. Any modification, equivalent replacement, improvement, etc. made within the spirit and principle of the present invention shall be included in the present invention. Within the scope of protection.
PUM


Description & Claims & Application Information
We can also present the details of the Description, Claims and Application information to help users get a comprehensive understanding of the technical details of the patent, such as background art, summary of invention, brief description of drawings, description of embodiments, and other original content. On the other hand, users can also determine the specific scope of protection of the technology through the list of claims; as well as understand the changes in the life cycle of the technology with the presentation of the patent timeline. Login to view more.