Marine temperature visual analysis method, intelligent terminal and storage medium

An analysis method and sea surface temperature technology, applied in the field of data processing, can solve the problems of massive volume, high density, and difficulty in displaying information in GIS systems, and achieve excellent performance

Pending Publication Date: 2020-06-23
GENEW TECH
View PDF1 Cites 4 Cited by
  • Summary
  • Abstract
  • Description
  • Claims
  • Application Information

AI Technical Summary

Problems solved by technology

However, the production of ocean temperature data is often carried out by satellites. It is characterized by massive volume and high density. It is difficult to display massive information only by GIS system. It must be combined with some excellent visualization methods of graphics to achieve it proudly.
[0003] At present, there is no clear and general solution in the industry to support the visualization of such special data. The difficulty lies in how to display the ocean temperature field composed of massive vector information points in a relatively smooth way, give a reasonable transition and ensure performance. good

Method used


Image

  • Marine temperature visual analysis method, intelligent terminal and storage medium
  • Marine temperature visual analysis method, intelligent terminal and storage medium
  • Marine temperature visual analysis method, intelligent terminal and storage medium

Examples


Embodiment Construction

[0037] In order to make the objectives, technical solutions and advantages of the present invention clearer and clearer, the present invention will be further described in detail below with reference to the accompanying drawings and examples. It should be understood that the specific embodiments described herein are only used to explain the present invention, but not to limit the present invention.

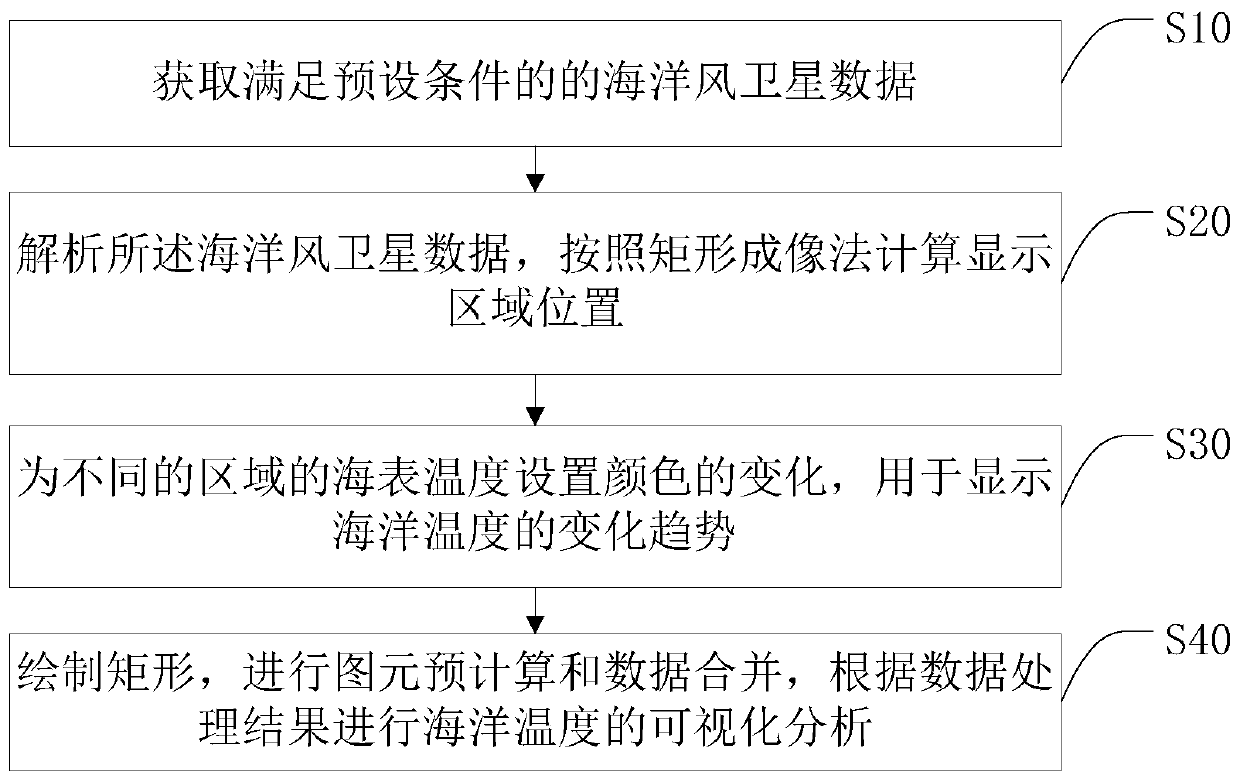
[0038] The visual analysis method of ocean temperature according to the preferred embodiment of the present invention, such as figure 1 As shown, the method for visual analysis of ocean temperature includes the following steps:

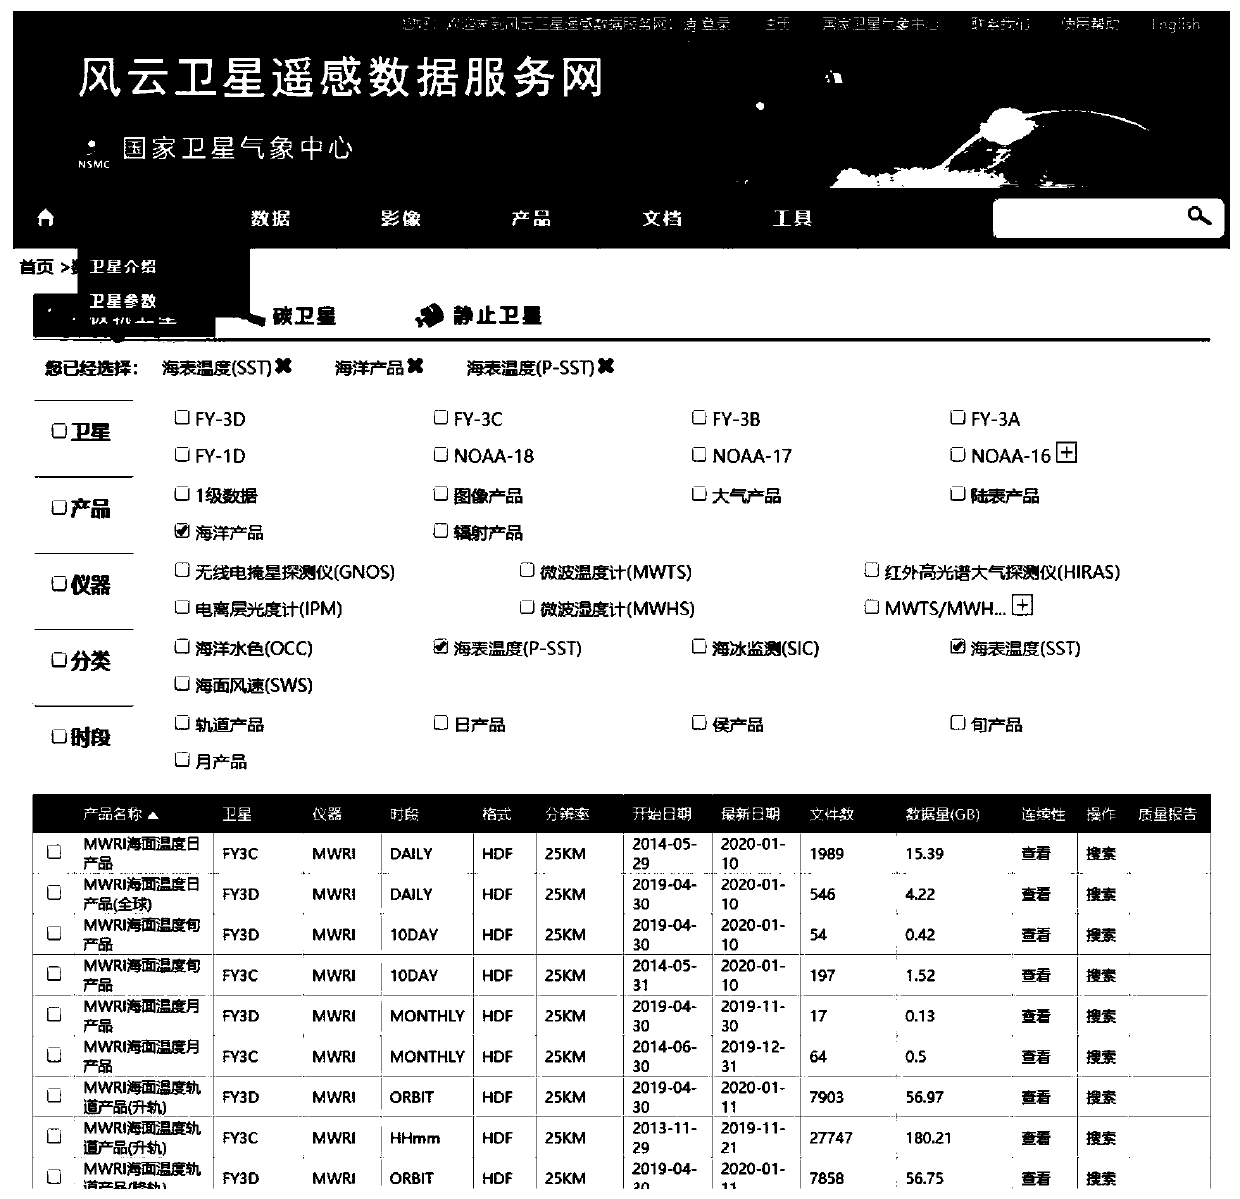
[0039] Step S10, acquiring ocean wind satellite data that meets a preset condition.

[0040] Specifically, according to the time and ocean wind accuracy, the ocean wind data that meets the preset conditions are screened out from the ocean wind satellite data, and the HDF (Hierarchical Data Format, a file format that can store different types of images an...


PUM


Abstract

The invention discloses an ocean temperature visual analysis method, an intelligent terminal and a storage medium. The method comprises the steps: acquiring ocean wind satellite data meeting preset conditions; analyzing the ocean wind satellite data, and calculating the position of a display area according to a rectangular imaging method; setting color changes for the sea surface temperatures of different areas, wherein the color changes are used for displaying the change trend of the sea temperature; drawing a rectangle, carrying out primitive pre-calculation and data merging, and carrying out visualized analysis on the ocean temperature according to a data processing result. According to the invention, the marine wind satellite data is collected by using the satellite data, the visual analysis of the marine temperature is realized, the marine temperature field only composed of massive vector information points is displayed in a smooth manner, reasonable transition is given, and excellent performance is ensured.

Description

technical field [0001] The invention relates to the technical field of data processing, in particular to a visual analysis method of ocean temperature, an intelligent terminal and a storage medium. Background technique [0002] Studying the change and composition of ocean temperature is the basic subject of ocean-related scientific research. Studying the cause, distribution and scope of ocean dynamics can analyze and solve many difficult problems. However, this analysis is inseparable from the dependence on the geographic information of the earth. The GIS system (Geographic Information System or Geo-Information system, geographic information system, it is under the support of computer hardware and software systems, the whole or part of the earth's surface (including the atmosphere) space related geographic distribution data collection, storage, technical systems for management, computation, analysis, display and description) provide just such a basic platform. However, the ...

Claims


Application Information

Patent Timeline
Patent Type & Authority Applications(China)
IPC IPC(8): G06F16/26G06F16/29
CPCG06F16/26G06F16/29
Inventor 郭博阳吴闽华姜坤卫宣安
Owner GENEW TECH
Why Eureka
Try Eureka