Driving behavior analysis method based on improved K-means
A behavioral analysis and behavioral technology, applied in the direction of instruments, character and pattern recognition, data processing applications, etc., can solve the problems of scientificity and poor accuracy of driving behavior clustering results, achieve high practical application value, and improve accuracy And the effect of high stability and accuracy
- Summary
- Abstract
- Description
- Claims
- Application Information
AI Technical Summary
Problems solved by technology
Method used
Image
Examples
specific Embodiment approach 1
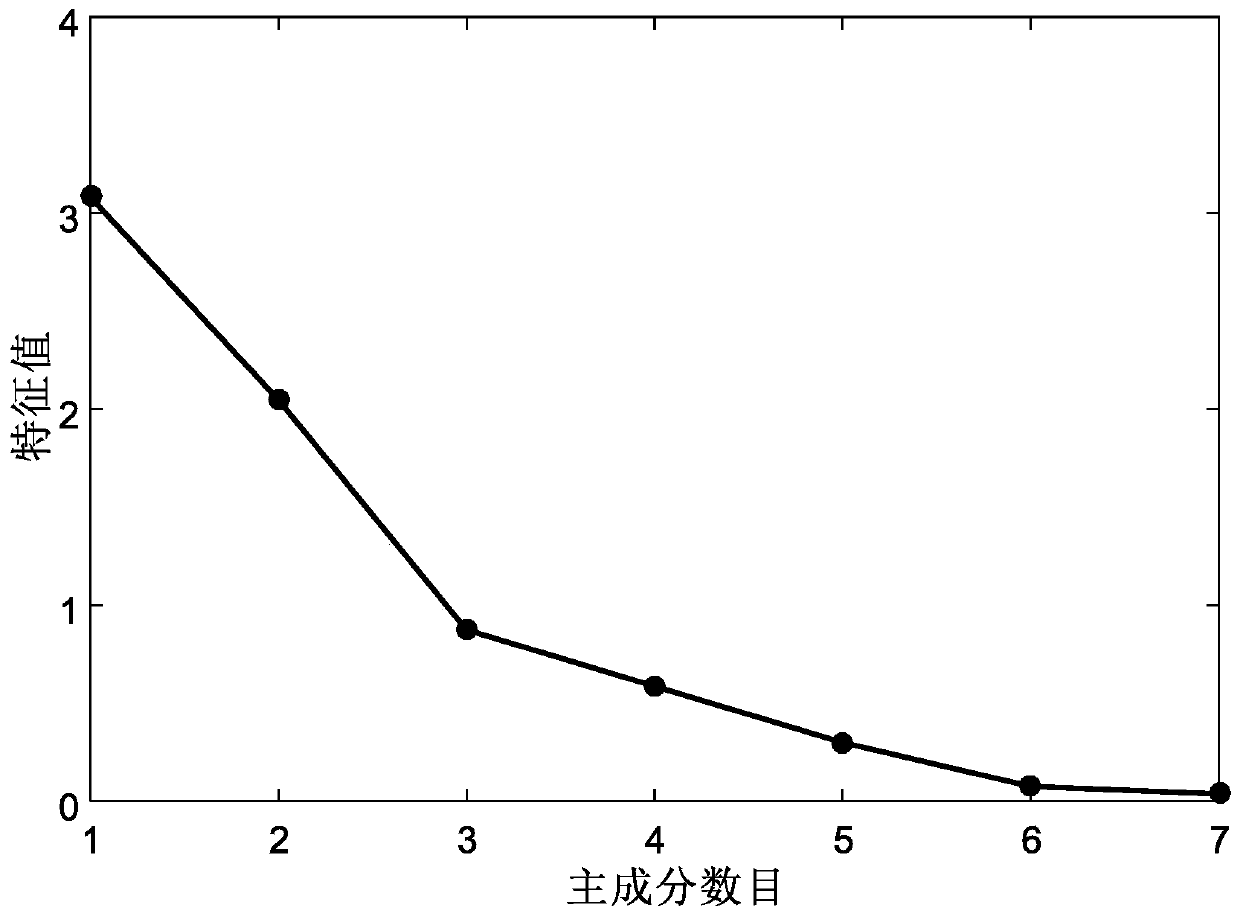
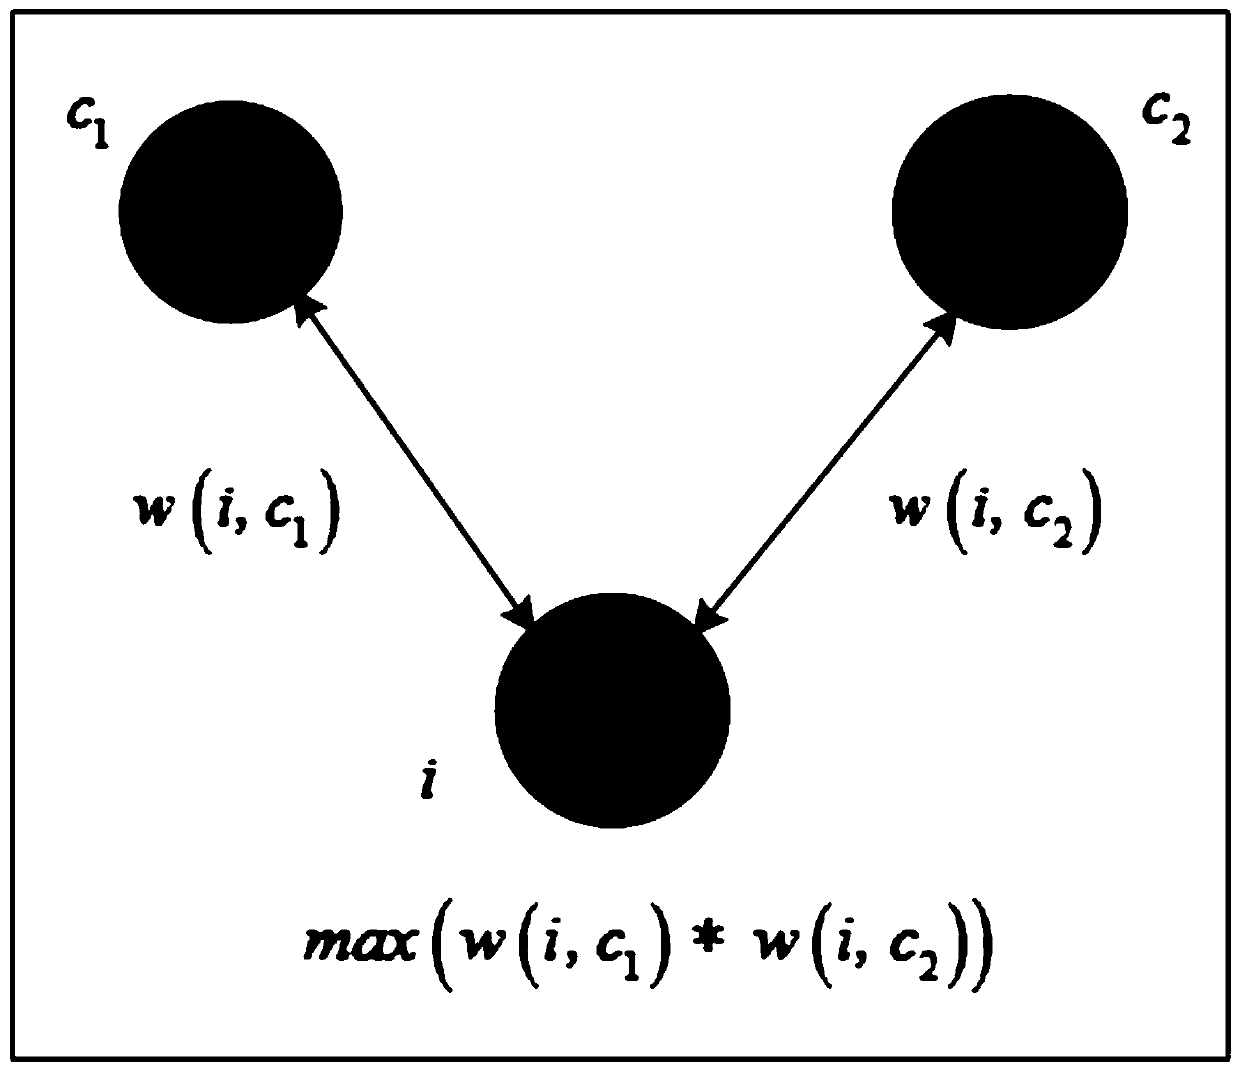
[0057] Specific implementation mode one: as figure 1 and Figure 4 As shown, a kind of driving behavior analysis method based on improved K-means described in this embodiment, the method comprises the following steps:
[0058] Step 1. Collect the raw data of driving behavior of m drivers, preprocess the collected raw data, and obtain the preprocessed data;
[0059] Step 2, extracting several characteristic parameter values from the preprocessed data, and then standardizing the extracted characteristic parameter values to obtain standardized characteristic parameter values;
[0060] Step 3, extracting the speeding tendency behavior factor P1 and the variable speed driving behavior factor P2 according to the characteristic parameter values after standardization, and calculating the score coefficient of each characteristic parameter value on the factor P1 and the score coefficient of each characteristic parameter value on the factor P2;
[0061] According to the score coe...
specific Embodiment approach 2
[0088] Embodiment 2: The difference between this embodiment and Embodiment 1 is that in the first step, the collected raw data is preprocessed, and the preprocessing method includes: filling missing values, filtering abnormal data, and deleting parking data.
[0089] During the driving process of the vehicle, the on-board sensors may be interfered by other devices, and there are abnormal values in the collected driving data. Therefore, the collected data needs to be processed in advance before analysis, that is, data preprocessing.
[0090] (1) Filling of missing values
[0091] Data may be disturbed by various factors during the process of collection, transmission, and storage, resulting in data loss and incompleteness, resulting in data loss in Redis and MySQL databases. Missing values are often handled by ignoring or imputing. When there are multiple missing values consecutively in the data set, the method of ignoring the missing values is adopted, that is, these m...
specific Embodiment approach 3
[0099] Specific embodiment three: the difference between this embodiment and specific embodiment one is that in the step two, several characteristic parameter values are extracted from the preprocessed data, and the characteristic parameter values include the vehicle speed average v a , speed standard deviation v s , overspeed time ratio η, daily average overspeed times, acceleration standard deviation a s , the daily average number of sudden accelerations and the daily average number of sudden brakes.
[0100] (1) Average speed v a
[0101] The higher the average vehicle speed, the greater the probability of a traffic accident.
[0102]
[0103] In the formula: v m is the vehicle speed value collected for the mth time; n is the total number of collected vehicle speed samples; v a is the average speed of the bus.
[0104] (2) Speed standard deviation v s
[0105] The larger the standard deviation of vehicle speed, the greater the dispersion of vehicle speed di...
PUM
 Abstract
Description
Claims
Application Information
 - R&D
- Intellectual Property
- Life Sciences
- Materials
- Tech Scout
- Unparalleled Data Quality
- Higher Quality Content
- 60% Fewer Hallucinations
Browse by: Latest US Patents, China's latest patents, Technical Efficacy Thesaurus, Application Domain, Technology Topic, Popular Technical Reports.
© 2025 PatSnap. All rights reserved.Legal|Privacy policy|Modern Slavery Act Transparency Statement|Sitemap|About US| Contact US: help@patsnap.com


