Image method for determining value range of microscopic segregation ratio in steel

A technology of value range and segregation, which is applied in analyzing materials, using wave/particle radiation for material analysis, testing metals, etc., can solve the problem that there is no strict regulation on the value range of micro-segregation ratio

Active Publication Date: 2020-09-18
SHOUGANG CORPORATION
View PDF13 Cites 2 Cited by
  • Summary
  • Abstract
  • Description
  • Claims
  • Application Information

AI Technical Summary

Problems solved by technology

[0005] The purpose of the present invention is to provide an image method for determining the value range of the micro-segregation ratio in steel, which solves the problem th

Method used


Image

  • Image method for determining value range of microscopic segregation ratio in steel
  • Image method for determining value range of microscopic segregation ratio in steel
  • Image method for determining value range of microscopic segregation ratio in steel

Examples


Embodiment 1

[0036] Dendrite segregation of Mn element in 380 wheel steel slab. Use the electronic probe to scan the surface of the polished surface of the 380 wheel steel billet sample for the Mn element, with a step size of 6 μm, and the scanning results are as follows figure 1 shown. The output is a 404×300 matrix and saved as a table in .csv format. Use Matlab to read the table file to get the matrix A of 404×300. Arrange the elements in the matrix into a 1×121200 sequence in ascending order, with the first place being 0.3668 and the last place being 4.7301. Let X take 5, 10, 15 and 20 respectively, and calculate the interval length L and C L and C (M×N-L) , listed in Table 1.

[0037] Table 1 The length and boundaries of the maximum and minimum intervals of content under different value ranges (Mn, wt%)

[0038] X L C L

C (M×N-L+1)

C min

C max

S R

5 6000 0.7991 0.9927 0.7811 1.0355 1.3256 10 12000 0.8135 0.9564 0.7940 1.0038 1.26...

Embodiment 2

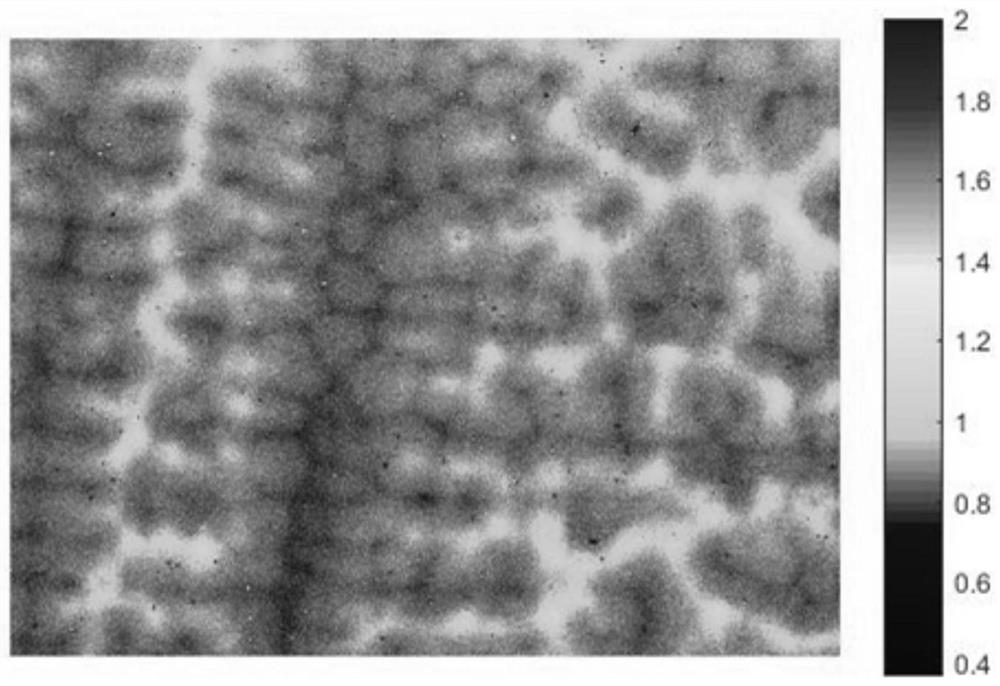
[0044] The 20CrMnTi hot-rolled sample has typical band-like characteristics, and the distribution of Mn and Cr elements is related to the band. Use the electronic probe to scan the surface of the Mn element on the polished surface of the 20CrMnTi sample perpendicular to the rolling direction, with a step size of 1.5 μm. The scanning results are as follows Image 6 As shown, the output is a 400×300 matrix, which is saved as a table in .csv format.

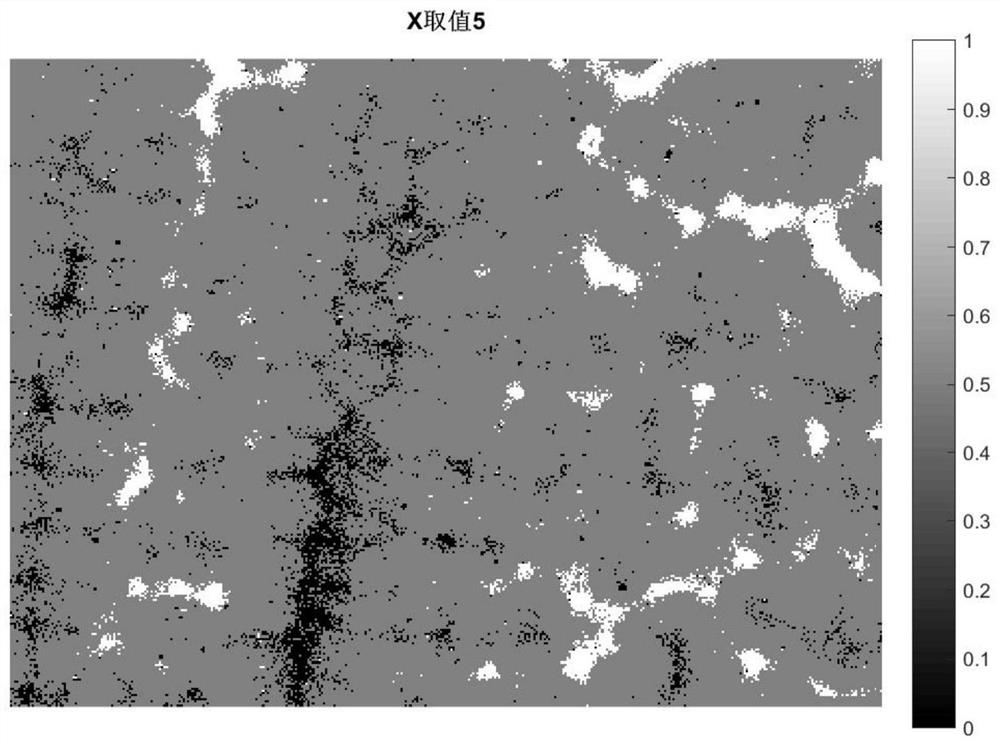
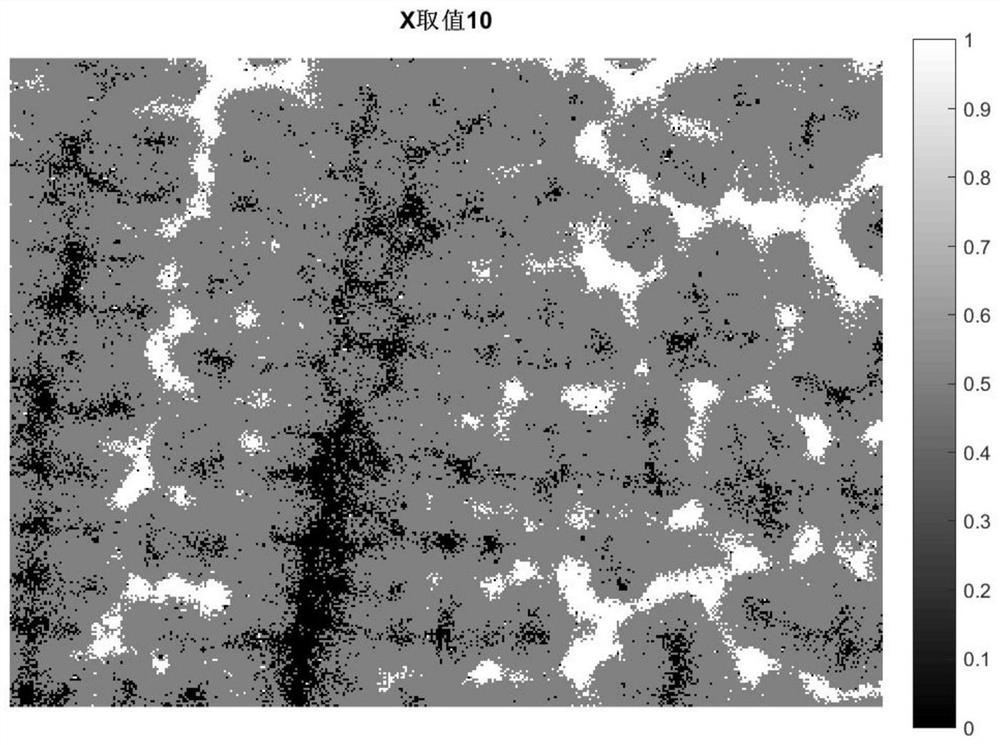
[0045] Using Matlab to read the table file of Mn elements. A matrix A of 400×300 is obtained. Arrange the elements in the matrix into a 1×120000 sequence in ascending order, with the first place being 0.3232 and the last place being 18.2245. Let X take 5, 10, 15 and 20 respectively, and calculate the interval length L and C L and C (M×N-L) , listed in Table 2. By the computer program in embodiment 1, obtain Figure 7 ~ Figure 10 , that is, the distribution of the area with the largest and smallest content when X is 5, 10, 15, ...

Embodiment 3

[0051] Utilize electron probe to do the surface scanning of Cr element to the polished surface of 20CrMnTi sample in embodiment 2, step-length 1.5 μ m, scanning result is as follows Figure 11 As shown, the output is a 400×300 matrix, which is saved as a table in .csv format.

[0052] Using Matlab to read the table file of Cr elements. A matrix A of 400×300 is obtained. Arrange the elements in the matrix into a sequence of 1×120000 in ascending order, the first place is 0.4631, and the last place is 1.8245. Let X take 5, 10, 15 and 20 respectively, and calculate the interval length L and C L and C (M×N-L) , listed in Table 3. By the computer program in embodiment 1, obtain Figure 12 to Figure 15 , that is, the distribution of the area with the largest and smallest content when X is 5, 10, 15, and 20, respectively.

[0053] Table 3 The length and boundaries of the maximum and minimum intervals of content under different value ranges (Cr, wt%)

[0054] X L C L...


PUM


Abstract

The invention discloses an image method for determining a value range of a microscopic segregation ratio in steel, and belongs to the technical field of measurement of microscopic segregation in steel. Surface scanning data of specific alloy element components of a sample are processed through a computer statistical program, and the value of X is determined through an image comparison method, thatis, the value range of the segregation ratio is calculated. And when the value range X changes, the distribution of the data points in the maximum content interval and the minimum content interval isdisplayed on the segregation tissue image in the form of an image. And a proper X value is selected according to the distribution rule of the data points. The method has the advantage that the valuerange of the microscopic segregation ratio in the steel can be accurately determined.

Description

technical field [0001] The invention belongs to the technical field of measuring micro-segregation in steel, in particular to an image method for determining the value range of micro-segregation ratio in steel, which is suitable for determining and calculating the value range of alloy element segregation ratio in steel. Background technique [0002] Segregation is the non-uniform distribution of chemical components caused by segregated crystallization of alloys during solidification. It appears as a dendrite in the slab, and forms a band after rolling. Segregation is unavoidable and has varying degrees of damage to the mechanical properties, crack resistance and corrosion resistance of steel. Engineering requires reliable qualitative characterization and accurate quantitative analysis of segregation. Quantitative information on the distribution of a certain element in the segregation structure of the steel can be obtained by using electron probe technology. On this basis, ...

Claims


Application Information

Patent Timeline
IPC IPC(8): G01N23/2252G01N33/202G01N33/204
CPCG01N23/2252G01N33/202G01N33/204G01N2223/079G01N2223/401G01N2223/624
Inventor 孟杨严春莲鞠新华
Owner SHOUGANG CORPORATION
Why Eureka
Try Eureka