Behavior quantification method based on states and maps and terminal
A behavioral and graph technology, applied in the field of data analysis, can solve the problems of staying, quantitative analysis of unavailable results, accurate classification errors, etc.
- Summary
- Abstract
- Description
- Claims
- Application Information
AI Technical Summary
Problems solved by technology
Method used
Image
Examples
Embodiment 1
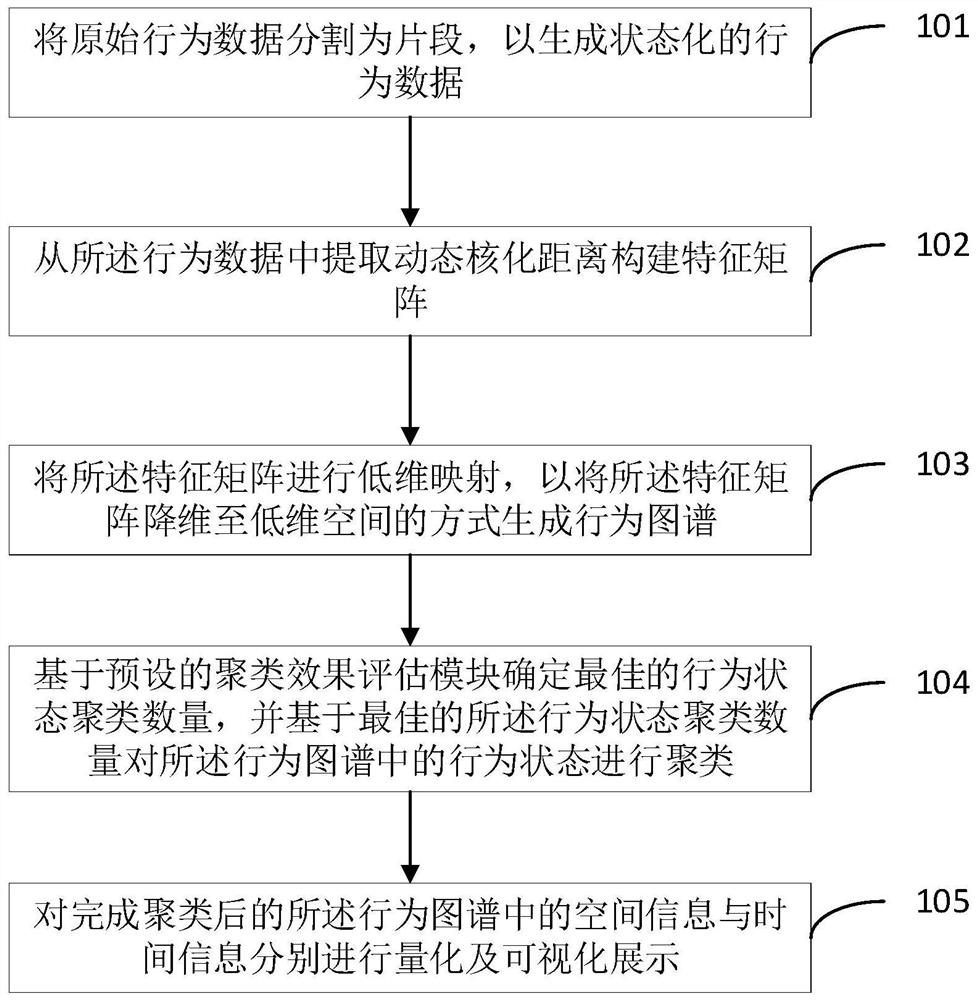
[0027] The embodiment of the present invention discloses a behavior quantification method based on state and map, such as figure 1 shown, including the following steps:
[0028] Step 101, dividing the original behavioral data into segments to generate stateful behavioral data;
[0029] Specifically, the "segmenting the original behavior data into segments to generate state-based behavior data" in step 101 includes: tracking the preset target based on the original behavior data and the preset pose estimation method (that is, the original behavior data A plurality of body feature points corresponding to the target) to generate a time series related to the feature points; a dynamic time series segmentation algorithm is used to segment the time series to generate stateful behavior data. Further, the dynamic time series segmentation algorithm includes: a hierarchical alignment clustering analysis algorithm.
[0030] Specifically, through step 101, the behavior data is segmented, ...
Embodiment 2
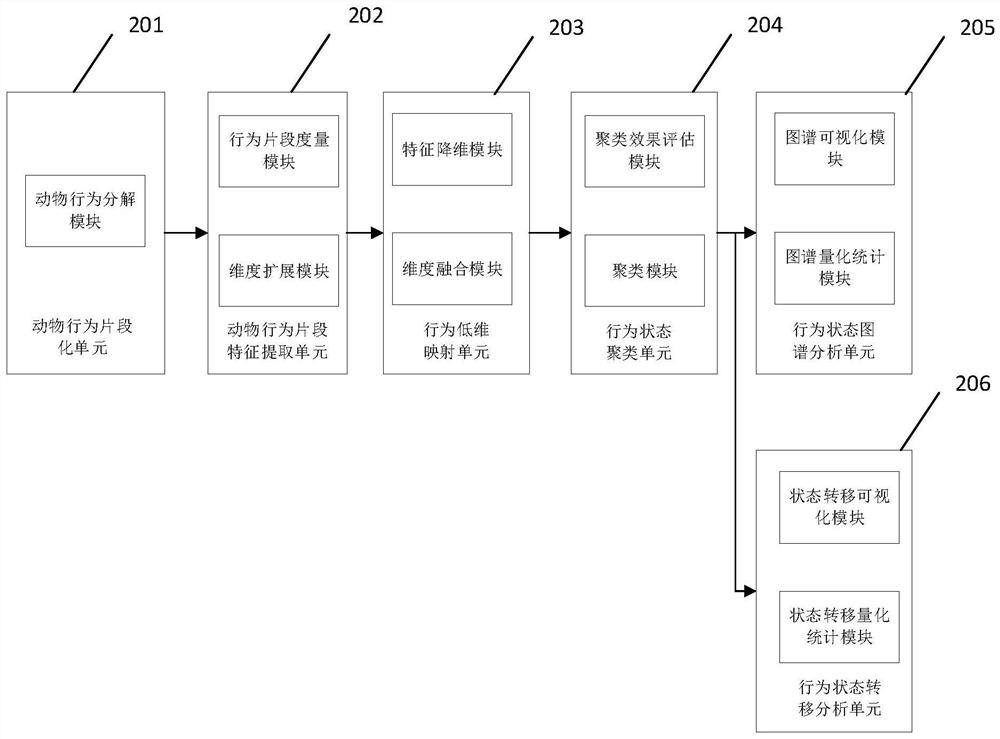
[0043] On the basis of Embodiment 1, Embodiment 2 of the present invention also discloses a behavior quantification method based on state and map, specifically, as figure 2 As shown, multiple units can be set in this scheme, specifically including: animal behavior fragmentation unit 201, animal behavior fragment feature extraction unit 202, behavior low-dimensional mapping unit 203, behavior state clustering unit 204, behavior state map analysis unit 205 and behavioral state transition analysis unit 206, these six parts.
[0044] In this way, step 101 in Embodiment 1 is executed by the animal behavior fragmentation unit, step 102 in Embodiment 1 is executed by the animal behavior fragment feature extraction unit, step 103 in Embodiment 1 is executed by the behavior low-dimensional mapping unit, and step 103 in Embodiment 1 is executed by the behavior low-dimensional mapping unit. The behavior state clustering unit executes step 104 in Embodiment 1, and the behavior state grap...
Embodiment 3
[0052] Embodiment 3 of the present invention, on the basis of Embodiments 1 and 2, proposes a behavior quantification method based on state and map based on specific application scenarios. The specific process is as follows:
[0053] First, the animal behavior fragmentation unit 201 is used to divide the raw animal behavior data into fragments in the time dimension. Animal behavior data is generally collected by a camera, which is video data. The behavior of animals is related to the movement of key parts of the body. Therefore, multiple body feature points of the target animal can be tracked through animal pose estimation methods (for example, existing animal pose estimation methods can be used), and animal motion skeletons can be constructed to generate and feature points. Correlated high-dimensional time series. The high-dimensional time series has time dynamics, so the dynamic time series segmentation algorithm can be used to fragment the animal motion skeleton. The spec...
PUM
 Abstract
Description
Claims
Application Information
 - R&D
- Intellectual Property
- Life Sciences
- Materials
- Tech Scout
- Unparalleled Data Quality
- Higher Quality Content
- 60% Fewer Hallucinations
Browse by: Latest US Patents, China's latest patents, Technical Efficacy Thesaurus, Application Domain, Technology Topic, Popular Technical Reports.
© 2025 PatSnap. All rights reserved.Legal|Privacy policy|Modern Slavery Act Transparency Statement|Sitemap|About US| Contact US: help@patsnap.com


