
Method and device for calculating signal-to-noise ratio from oscillogram and checking noise intensity

A technology of noise intensity and signal-to-noise ratio, applied in the field of computer programming language, can solve problems that affect signal quality, board performance, and batch processing cannot be done.

Inactive Publication Date: 2020-12-25
SUZHOU LANGCHAO INTELLIGENT TECH CO LTD
View PDF0 Cites 0 Cited by
  • Summary
  • Abstract
  • Description
  • Claims
  • Application Information

AI Technical Summary

Problems solved by technology

[0004] 1. The waveform that passes the test may be interfered by the noise signal, and the noise signal will not be used as an indicator of the test failure during the test, but it will affect the quality of the signal and the performance of the board
[0005] 2. For the case of too many test cases, batch processing cannot be done

Method used


Image

  • Method and device for calculating signal-to-noise ratio from oscillogram and checking noise intensity
  • Method and device for calculating signal-to-noise ratio from oscillogram and checking noise intensity
  • Method and device for calculating signal-to-noise ratio from oscillogram and checking noise intensity

Examples


Embodiment

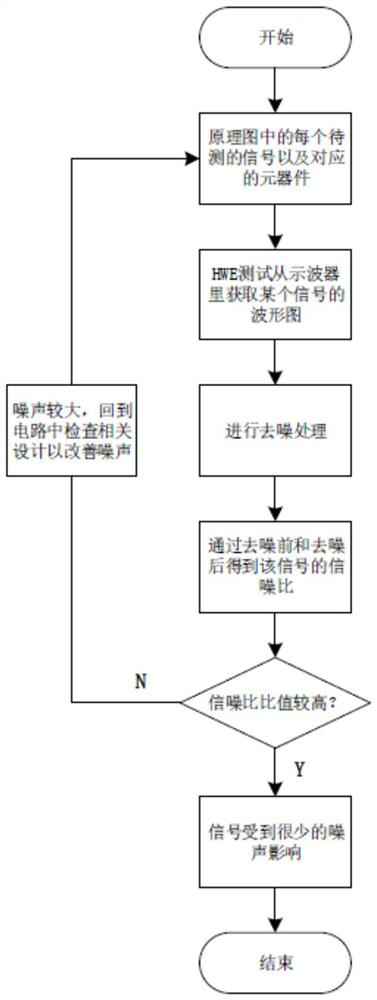
[0049] A way to calculate the signal-to-noise ratio from a waveform plot and check the noise strength:

[0050] 1. Based on the signal waveform diagram of the oscilloscope, the denoising effect on the signal is realized by calling the image processing module of the Python tool.

[0051] 2. Based on the denoised signal, the signal-to-noise ratio of the original signal is calculated by calling the image processing function module of the Python tool.

[0052] 3. Based on a large number of test cases, the advantages of Python tools are used to achieve batch processing to obtain the corresponding signal-to-noise ratio of each signal

[0053] The denoising description about the signal in this embodiment:

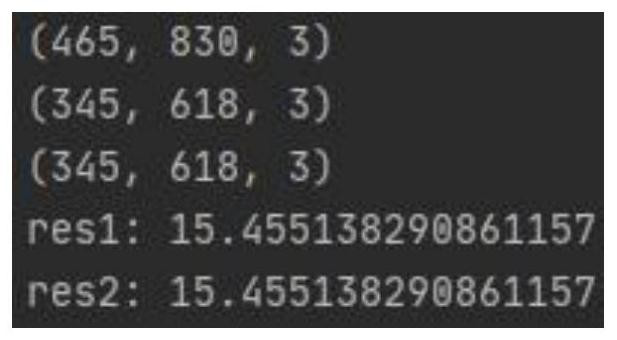
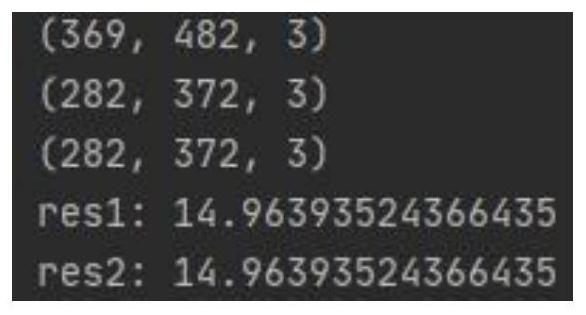
[0054] Obtain the waveform diagram of the signal through the oscilloscope, taking the PWRGD_P12V_HDD signal as an example, such as figure 2 shown. Call the image processing module in the Python tool (Matlab tool can also be used), one of the functions is fastNlMeansDenoising, ...


PUM


Abstract

The invention discloses a method and device for calculating a signal-to-noise ratio from an oscillogram and checking noise intensity, and the method comprises the steps: denoising an original waveformof a signal obtained by an oscilloscope through calling an image processing module of Python, and calculating the signal-to-noise ratio of a measured signal; with steps of denoising the signal, searching similar areas in an image by taking an image block in a whole signal oscillogram obtained by an oscilloscope as a unit, averaging the areas and removing noises in the image; processing signal-to-noise ratio: comparing the denoised signal oscillogram with an original signal oscillogram obtained by an oscilloscope, and calculating the signal-to-noise ratio so as to judge the influence of noiseon the signal; and processing signal batch: carrying out above two steps of processing on other signals in the signal oscillogram to obtain different PSNR results, and obtaining an average range of asignal-to-noise ratio based on the plurality of PSNR results. The original signal waveform obtained in the oscilloscope can be denoised and then compared with the original signal, the signal-to-noiseratio is calculated, and therefore the noise intensity is judged.

Description

technical field [0001] The invention relates to the field of cross-platform computer programming language, in particular to a method and device for calculating the signal-to-noise ratio and checking the noise intensity from a waveform diagram. Background technique [0002] Python is a cross-platform computer programming language. It is a high-level scripting language that combines interpretability, compilation, interactivity and object-oriented. It can complete various advanced tasks. Welcome, a computer programming language that also has a wide range of applications. In the field of engineering, for hardware engineers, HW testing is essential. While seeing the specific signal waveform, it can also indirectly measure the performance of the board. Usually, the oscilloscope used in HW test can display signal waveform, high and low level values, maximum and minimum values, and time period and other parameters. However, some signals will be affected by noise. Noise refers to i...

Claims


Application Information

Patent Timeline
IPC IPC(8): G06K9/00
CPCG06F2218/04G06F2218/12
Inventor 刘庆元
Owner SUZHOU LANGCHAO INTELLIGENT TECH CO LTD
Learn More