Data-driven high-proportion renewable energy power system operation scene identification method
A renewable energy and power system technology, applied in the direction of electrical digital data processing, special data processing applications, information technology support systems, etc., can solve the problems of identifying high-proportion renewable energy power system operating scenarios and their changing laws The effect of improving identification ability and improving operation efficiency
- Summary
- Abstract
- Description
- Claims
- Application Information
AI Technical Summary
Problems solved by technology
Method used
Image

Examples
Embodiment Construction
[0054] The present invention proposes a data-driven high-proportion renewable energy power system operating scene identification method. The present invention will be further described in detail below in conjunction with the accompanying drawings and specific embodiments.
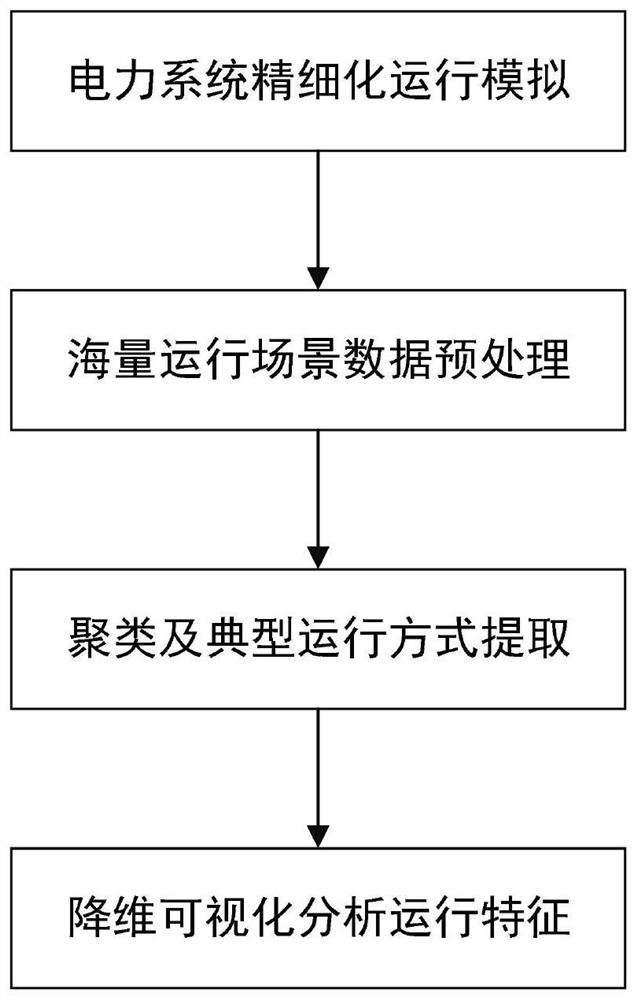
[0055] The present invention proposes a data-driven high-proportion renewable energy power system operation scene identification method, the overall process is as follows figure 1 shown, including the following steps:
[0056] 1) Refined operation simulation of the power system to be identified to obtain the daily operation mode vector of the system;
[0057] Obtain power system load data, unit information, network topology information, renewable resources and their temporal-spatial correlation information from the power system operation planning department (load data and renewable resource information are annual hourly data), use TH-DSED Software for power system refinement operation simulation (TH-DSED s...
PUM
 Abstract
Description
Claims
Application Information