Building solar potential rose diagram drawing method

A rose diagram and solar energy technology, applied in 3D modeling, image data processing, special data processing applications, etc., can solve problems such as inability to analyze

Active Publication Date: 2021-03-30
NORTHWESTERN POLYTECHNICAL UNIV
View PDF5 Cites 1 Cited by
  • Summary
  • Abstract
  • Description
  • Claims
  • Application Information

AI Technical Summary

Problems solved by technology

Therefore, the existing solar energy potential assessment methods lack the analysis from the perspective of

Method used


Image

  • Building solar potential rose diagram drawing method
  • Building solar potential rose diagram drawing method
  • Building solar potential rose diagram drawing method

Examples


example

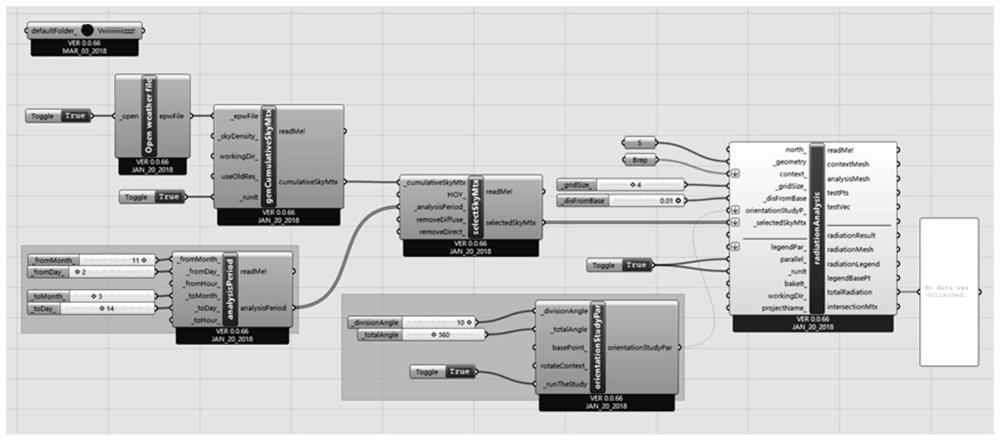
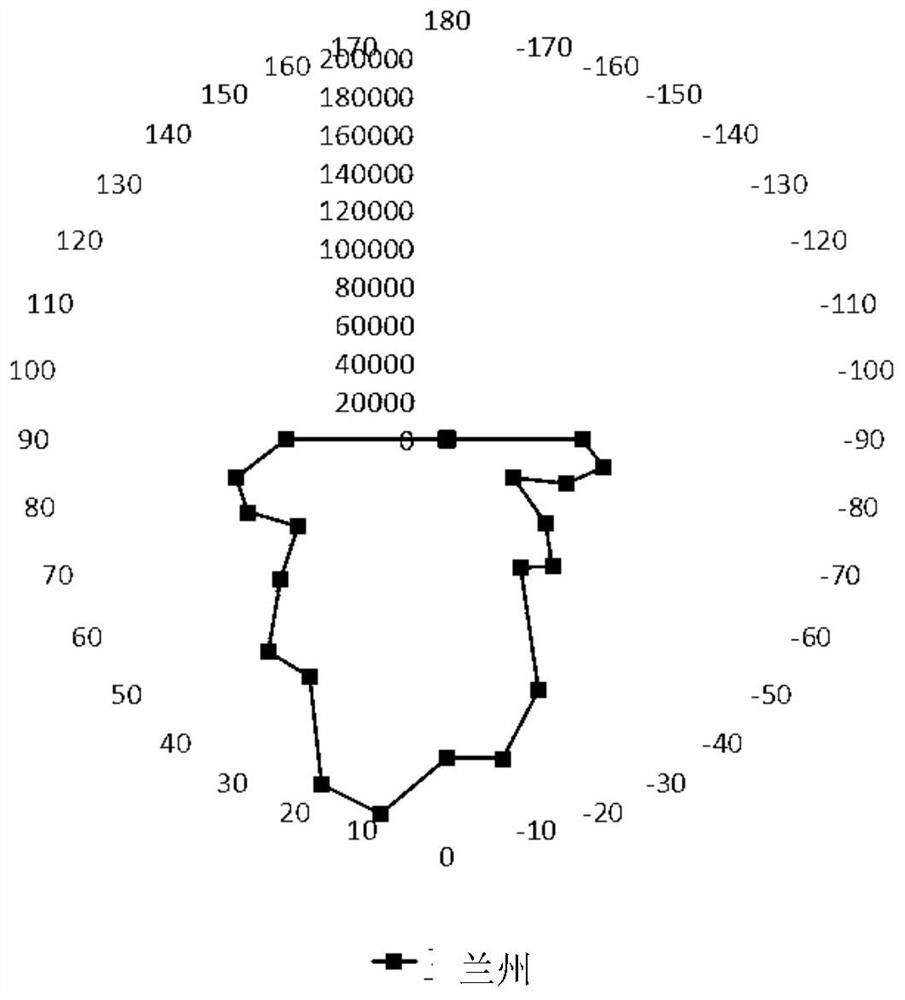
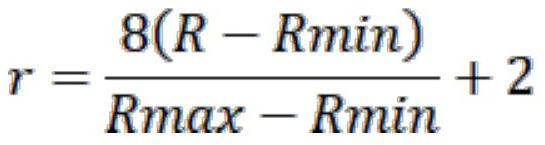
[0075] In order to clearly describe the content of the present invention, the rose diagram of solar energy potential in Lanzhou City is selected to describe the implementation steps in detail.

[0076] (1) Get data:

[0077] Obtain the meteorological data (EPW format) of the location of the assessed building. If you cannot find the corresponding city, you can choose a city with a closer geographical location to replace it. Visit http: / / www.ladybug.tools / epwmap / , select Lanzhou EPW file to download.

[0078] (2) Determine the evaluation period:

[0079] The evaluation period needs to be a continuous time, accurate to the day. The selected evaluation time period is from November 02 to March 14.

[0080] (3) Establish the three-dimensional model to be evaluated:

[0081] ① Obtain the size of the outer envelope of the tested building and surrounding sheltered buildings. Regardless of the size of the opening, the wall is used instead.

[0082] ②Construct the exterior surface...


PUM


Abstract

The invention relates to a building solar energy potential rose diagram drawing method, and the method starts from a building monomer, and uses a certain building to obtain the sum of solar radiationin a certain orientation within a specified time period to represent the solar energy potential of the building in the orientation. The potential of solar energy has vector characteristics, i.e., directions and sizes. Therefore, the building solar potential rose diagram is drawn by integrating the building orientation and the corresponding solar radiation quantity. The rose diagram can visually express the relation between the orientation of the single building and the obtained solar energy under specific conditions, the solar energy potential of the building can be conveniently evaluated fromthe orientation angle, and the optimal orientation of the building can be determined in an assisted mode in the design stage. In addition, the problem that in traditional building orientation designsimulation, only the optimal orientation is given or only the optimal range is pointed out, and other result expression modes are single can be solved.

Description

technical field [0001] The invention belongs to the field of building solar energy potential evaluation and relates to a method for drawing a building solar energy potential rose diagram. Background technique [0002] The traditional evaluation of solar energy potential is mainly from a macro perspective, and the object of evaluation is usually a certain region or city. For example, in China’s solar energy resource distribution map, it is divided into five categories. The smallest area includes most of Sichuan’s regional level Guizhou, and the largest The subdivision involves 11 provinces. This kind of macro assessment is difficult to assess the impact of the surrounding environment on solar radiation in a small area, and the surrounding shelters in a small area, such as buildings and mountains, have a great impact on the solar energy utilization of buildings. In addition, the choice of different shapes of the building itself will also have an impact on solar energy utiliza...

Claims


Application Information

Patent Timeline
IPC IPC(8): G06F30/13G06F30/20G06T17/00
CPCG06F30/13G06F30/20G06T17/00
Inventor 刘奕郝上凯刘煜郑武幸王晋邵腾
Owner NORTHWESTERN POLYTECHNICAL UNIV
Why Eureka
Try Eureka