

Method for detecting GCK-MODY gene mutation and kit for method
A kit and single-gene technology, applied in biochemical equipment and methods, recombinant DNA technology, and microbial assay/inspection, etc., can solve the problems of difficult promotion of genetic testing and high testing costs
- Summary
- Abstract
- Description
- Claims
- Application Information
AI Technical Summary
Problems solved by technology
Method used
Image

Examples
Embodiment 1
[0157] Embodiment 1 utilizes the primer set of table 1 to carry out PCR amplification
[0158] The DNA from 6 cases of blood and 6 cases of saliva samples were respectively used to amplify and sequence using the primer sets in Table 1. The specific specificity results are shown in Table 7, wherein the average specificities of blood samples and saliva samples are respectively 92.21% and 91.25%.
[0159] Table 7: Amplification System Specificity
[0160] sample number blood sample sample number saliva sample A01 0.926421247 A07 0.925325711 A02 0.921028152 A08 0.909607595 A03 0.919981356 A09 0.915062707 A04 0.931412141 A10 0.895322696 A05 0.918928511 A11 0.90819824 A06 0.915019602 A12 0.921748681
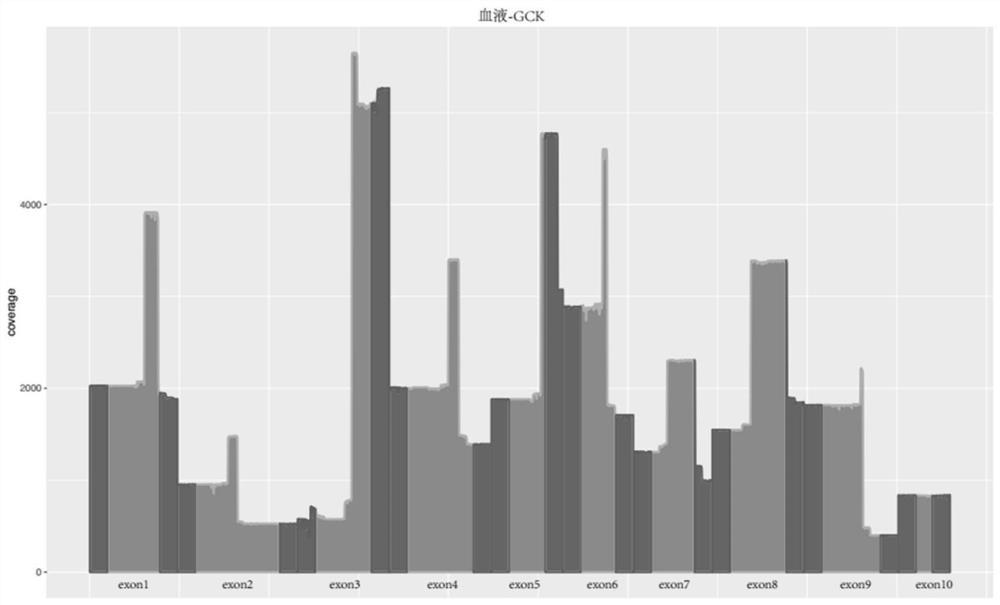
[0161] Tables 8 and 9 below show the degree of amplification equilibrium, which is characterized by the number of reads amplified by each amplicon. In 6 blood samples and 6 saliva samples, the number of reads amplified by ...
Embodiment 2
[0172] Embodiment 2 utilizes the primer set of table 2 to carry out PCR amplification
[0173] The DNA of 10 diabetic patients was respectively used, and the primer sets in Table 2 were used to amplify, build a library, and sequence the DNA of 10 samples. For the specificity of each sample, see Table 11 below. The average specificity of the 10 samples The sex is 0.9.
[0174] Table 11: Amplification System Specificity
[0175] sample number 501 502 503 504 505 506 507 508 509 510 specificity 0.90 0.90 0.90 0.89 0.91 0.90 0.87 0.91 0.92 0.91
[0176] Table 12 below shows the degree of amplification equilibrium, which is characterized by the number of reads amplified by each amplicon. In the 10 samples, the number of reads amplified by each amplicon and the average value are shown in Table 12 below:
[0177] Table 12: Amplification Balance
[0178]
[0179]
[0180] The analysis of 10 samples proves that the amplification system h...
Embodiment 3
[0186] Example 3 DNA pooling method
[0187] Calculation of the number of samples (pool size) that should be mixed in each mixed sample:
[0188] According to the principle of cost minimization, the number of samples that should be mixed in each mixed sample corresponds to an optimal scheme according to the prevalence rate. Assuming that the cost of each genetic test is M, the incidence of diabetes in the population is a%, and there are n individuals in each mixed sample, including N diabetic patients, the total cost ranges from NM / n+N*a Between %*M~NM / n+N*a%*n*M. The lowest-cost hybrid solution should meet the following criteria:
[0189] NM / n+N*a%*n*M
[0190] NM / n+nNM*a%
[0191] According to this mathematical model, the optimal mixed scheme corresponding to different prevalence rates is obtained as follows: Figure 5 shown, based on Figure 5 The calculation formula shown below is obtained:
[0192] -1 / 2+sqrt(1 / 4+1 / a%)
PUM
 Abstract
Description
Claims
Application Information