Method for identifying transformer area user-transformer relation based on electric quantity correlation of user branches

A correlation and power consumption technology, applied in data processing applications, instruments, forecasting, etc., can solve the problems of high consumption of computing resources, inability to accurately determine whether a user does not belong to a certain station area, low accuracy, etc., and achieve positive results The effect of negatively correlated feature enhancement

Pending Publication Date: 2021-06-25
SHANGHAI MUNICIPAL ELECTRIC POWER CO +1
View PDF0 Cites 2 Cited by
  • Summary
  • Abstract
  • Description
  • Claims
  • Application Information

AI Technical Summary

Problems solved by technology

[0008] Since the substation areas that need to be identified for household substations are generally public substation areas, when using the correlation analysis results of electricity consumption and electricity for household substation identification, since the proportion of electricity consumption of a single user in the substation area is relatively low, its negative correlation characteristics are not Obviously, it cannot be accurately judged that the user does not belong to a certain station area. At the same time, the existing correlation technology can only judge that the user does not belong to the current station area. It is necessary to search all the station areas for correlation analysis, and determine N from the N station areas. - Only one station area is negatively correlated with the user to accurately locate the target station area, which consumes too much computing resources, and the accuracy is extremely low due to the large number of station areas

Method used


Image

  • Method for identifying transformer area user-transformer relation based on electric quantity correlation of user branches
  • Method for identifying transformer area user-transformer relation based on electric quantity correlation of user branches
  • Method for identifying transformer area user-transformer relation based on electric quantity correlation of user branches

Examples


Embodiment 1

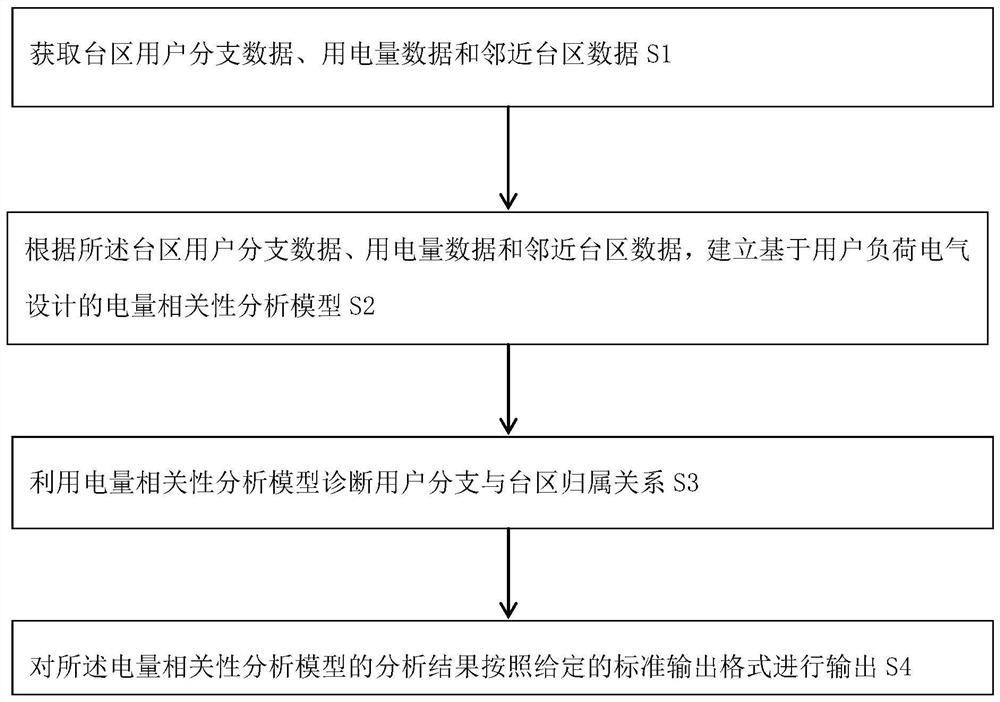
[0036] like figure 1 As shown, the present invention is implemented in this way. The method for identifying the relationship between households in a station area based on the power correlation of the user branch includes the following steps:

[0037] S1: Obtain user branch data, power consumption data and adjacent station area data in the station area;

[0038] S2: According to the user branch data, power consumption data and adjacent station area data above, establish a power correlation analysis model based on user load electrical design;

[0039] S3: Use the power correlation analysis model to diagnose the ownership relationship between user branches and station areas;

[0040] S4: Analyze the above results and output them in a given standard output format.

[0041] Neighboring stations were diagnosed through archival data analysis prior to the S1 proceeding. Adjacent station area data includes station area name adjacent, user branch data adjacent to collection and / or po...


PUM


Abstract

The invention belongs to the field of electric power topology big data analysis, and particularly relates to a method for identifying a transformer area user-transformer relation based on electric quantity correlation of user branches. The invention includes the following steps: S1, obtaining transformer area user branch data, power consumption data and adjacent transformer area data; S2, establishing an electric quantity correlation analysis model of the user branches; S3, using the electric quantity correlation analysis model to diagnose the affiliation relationship between the user branches and the transformer area; and S4, outputting a transformer area user-transformer relation result. On the basis of user classification, user branch data and adjacent transformer area data, positive correlation characteristics are provided by utilizing a Pearson's correlation coefficient, and the affiliation relationship between the user branch and the plurality of transformer areas is diagnosed by utilizing the quantitative trend change of positive and negative correlation coefficient values of the user branch and the two or more transformer areas, so that the transformer user relationship identification is realized. Point selection strategies participating in correlation calculation are optimized for users with different electricity utilization characteristics, positive and negative correlation characteristics are enhanced, the recognizable user range is further expanded, and the accuracy of table user relation recognition is improved.

Description

technical field [0001] The invention belongs to the field of power topology big data analysis, and in particular relates to a method for identifying the relationship between households in a station area based on the electric quantity correlation of user branches. Background technique [0002] With the full coverage of the electricity consumption information collection system, the most important operating data can be collected daily, as the most important operating data are the assessment table on the transformer side of the station area and the electricity sales data of the user's electric energy meter. According to the law of energy conservation, there is the following relationship between the supply and sale of electricity in the station area, that is: the power supply of the station area assessment meter = the sum of the electricity sales of each user's sub-meter + the line loss of the station area. [0003] When the user meter does not belong to the station area, how muc...

Claims


Application Information

Patent Timeline
Patent Type & Authority Applications(China)
IPC IPC(8): G06Q10/04G06Q10/06G06Q50/06
CPCG06Q10/04G06Q10/06393G06Q50/06
Inventor 朱铮张永康杜成刚戴辰俞磊陈海宾蒋超许堉坤陈明沈晓枉李蕊张芮嘉安佰龙罗伟李问溪
Owner SHANGHAI MUNICIPAL ELECTRIC POWER CO
Why Eureka
Try Eureka