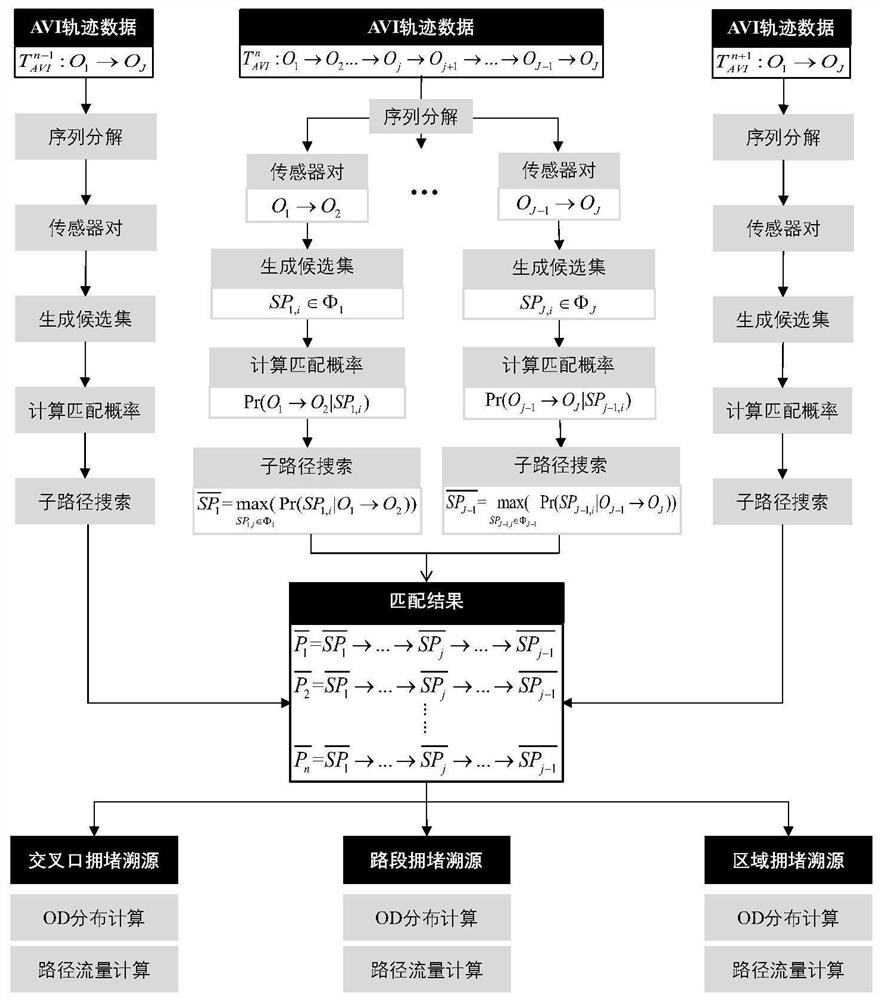
Traffic congestion traceability method based on multi-source data
A technology of traffic congestion and multi-source data, which is applied in the traffic control system of road vehicles, traffic flow detection, traffic control system, etc., and can solve problems such as position deviation, lack of map matching algorithm, and insufficient data sample size
- Summary
- Abstract
- Description
- Claims
- Application Information
AI Technical Summary
Problems solved by technology
Method used
Image
Examples
Embodiment 1
[0147] (1) Data collection and extraction
[0148] Road network: In the experiment, the road network in Shenzhen, China, with a total length of 21,985 kilometers, was used. The city-wide network map covers a spatial extent of 40×50 kilometers, including 237,440 nodes and 215,771 road connections.
[0149] AVI dataset: A dataset of AVI detected by 715 stationary sensors was collected in Shenzhen from September 1 to October 31, 2016. The locations of these fixed sensors are as Figure 9 shown in the dots. The distribution histograms of the temporal and spatial gaps of the AVI observation pairs were calculated, respectively as follows Figure 10 and Figure 11 shown. The mean, median and variance of the time gap are 12.18min, 5.54min and 252.83min, respectively 2 , the corresponding statistics for the spatial separation are 16.25 km, 10.23 km and 292.93 km, respectively 2 . The various statistical indicators of AVI data are shown in Table 1. The temporal and spatial inter...
Embodiment 2
[0161] (1) Experimental data collection
[0162] Nigang Road is an east-west expressway in Shenzhen, with a total length of 3.4 kilometers. It starts from Nigang Overpass in the west, connects with Beihuan Avenue, and ends at Honghu Overpass in the east and connects with Buxin Road. There is Nigang in the middle. Hongling Interchange can enter Yuping Avenue (Qingping Expressway) and Honggang Road to the north, Hongling North Road to the south, and there are ramps to the south to enter Qingshuihe Third Road and Honghu West Road.
[0163] The Shenzhen road network, the cellular grid network, and the position of the video bayonet with data are composited in QGIS to form a base map, and the corresponding cellular grids and OD points are numbered, such as Figure 14 shown.
[0164] The circles represent different ramp entrances, representing 8 OD communities; the small dots represent 6 video bayonet ports where data can be collected in and around Nigang Road, see Table 3 for speci...
PUM
 Abstract
Description
Claims
Application Information
 - R&D
- Intellectual Property
- Life Sciences
- Materials
- Tech Scout
- Unparalleled Data Quality
- Higher Quality Content
- 60% Fewer Hallucinations
Browse by: Latest US Patents, China's latest patents, Technical Efficacy Thesaurus, Application Domain, Technology Topic, Popular Technical Reports.
© 2025 PatSnap. All rights reserved.Legal|Privacy policy|Modern Slavery Act Transparency Statement|Sitemap|About US| Contact US: help@patsnap.com


