Storage and visualization method for high-precision climate change data

A climate change, high-precision technology, applied in other database browsing/visualization, other database retrieval, other database indexing, etc., can solve the problems of lack of climate forecast verification, etc., and achieve the effect of realizing visualization and convenient webpage integration method

Pending Publication Date: 2021-12-03
NORTH CHINA ELECTRIC POWER UNIV (BAODING)
View PDF0 Cites 1 Cited by
  • Summary
  • Abstract
  • Description
  • Claims
  • Application Information

AI Technical Summary

Problems solved by technology

Both ensemble methods can generate a large number of future climate projections for various scenarios, but due to the lack of validation of climate projections, how to combine and interpret these multiple projections into policy-relevant information has become a major challenge in recent years

Method used


Image

  • Storage and visualization method for high-precision climate change data
  • Storage and visualization method for high-precision climate change data
  • Storage and visualization method for high-precision climate change data

Examples


Embodiment Construction

[0074] The present invention proposes a method for storing and visualizing high-precision climate change data. The present invention will be further described below in conjunction with the accompanying drawings and specific embodiments.

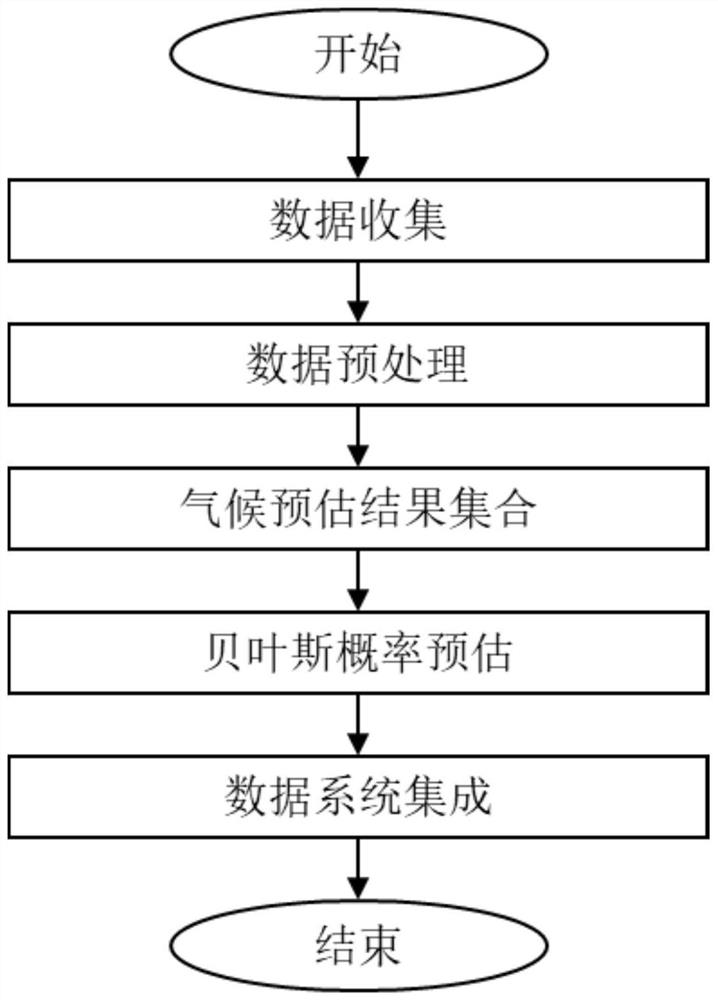
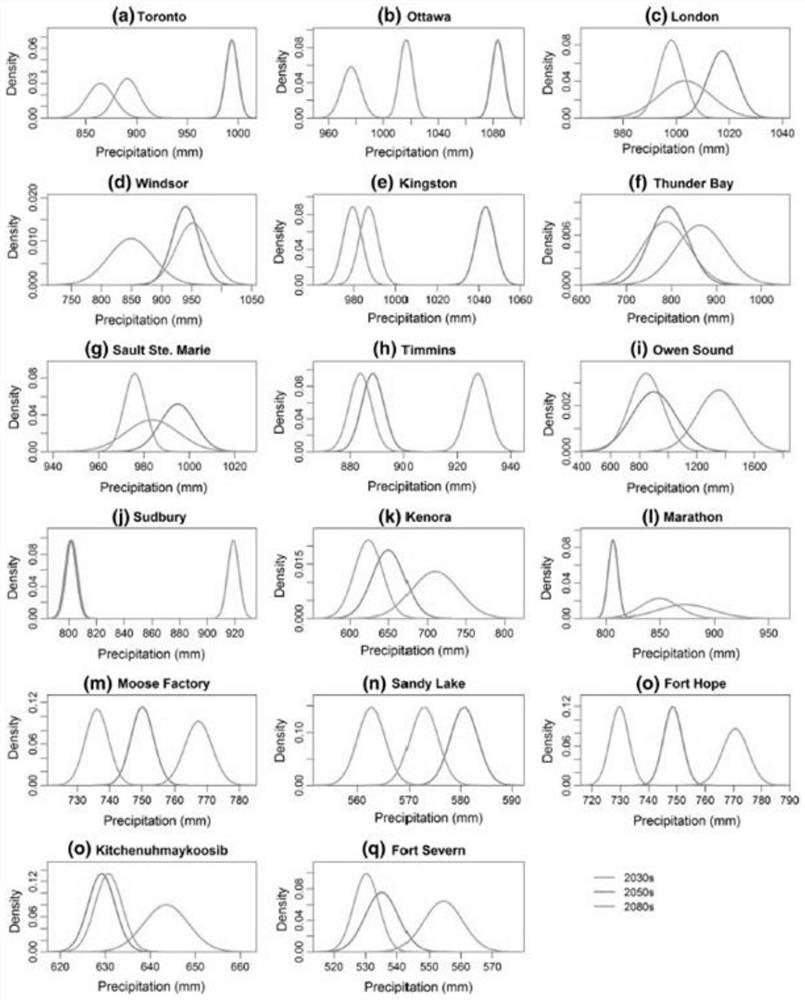
[0075] figure 1 It is a technical roadmap of a storage and visualization method for high-precision climate change data of the present invention; figure 2 Probability projection map for climate data with precipitation as an example.

[0076] The technical plan is divided into 5 steps. details as follows:

[0077] 1) Data Collection—Meteorological observation data are the basis for developing methods based on climate models and probabilistic projections. The temperature and precipitation reanalysis data were selected from the ERA5 dataset provided by ECWMF Meteorological Organization; the temperature and precipitation data under historical and future (SSP245 and SSP585) scenarios were collected from CMIP6 GCM as model input.

[0078] 2) Da...


PUM


Abstract

The invention discloses a storage and visualization method for high-precision climate change data, and belongs to the technical field of regional climate change. The method comprises the steps: step 1, selecting reanalysis data of temperature and rainfall in an ERA5 data set, and selecting temperature and rainfall data under SSP245 and SSP585 scenes in the CMIP6GCM as model input; step 2, using an interpolation method to make up for missing values of the data in the step 1; step 3, performing climate simulation by using the regional climate model to obtain a climate estimation set of future temperature precipitation; step 4, generating set probability estimation of climate variable change based on the climate estimation set in the step 3; and step 5, realizing the visualization of the data at the browser side through the API (Application Program Interface) and the layer of the ArcGISonline and the javascript. According to the method, climate details of local scales can be better reflected; and the uncertainty of observation errors, model reliability and climate change signal time correlation is effectively reflected, and the visualization of climate data is realized.

Description

technical field [0001] The invention relates to the technical field of regional climate change, in particular to a storage and visualization method for high-precision climate change data. Background technique [0002] Climate change is becoming one of the world's most pressing issues. To meet the challenge, countries and regions have been taking careful steps to protect their health, economies and communities from the harmful effects of climate change. Therefore, there is an urgent need to develop more refined and reliable high-resolution climate projections to provide useful information for decision makers or policy makers to assess the likely future impacts of climate change on a regional or community scale. [0003] Our incomplete understanding of the complex physical processes and natural variability of the climate system and responses to rising levels of greenhouse gases inevitably entails uncertainties in these projections. This further leads to considerable uncertai...

Claims


Application Information

Patent Timeline
Patent Type & Authority Applications(China)
IPC IPC(8): G06F30/27G06F16/901G06F16/904G06N7/00G06F111/08
CPCG06F30/27G06F16/901G06F16/904G06F2111/08G06N7/01
Inventor 吴莹辉黄国和周雄翟媛媛鲁晨宋唐女
Owner NORTH CHINA ELECTRIC POWER UNIV (BAODING)
Why Eureka
Try Eureka