

Air quality prediction method in gridding monitoring
A technology of air quality and prediction method, applied in the field of deep learning, to improve the fitting effect, improve the accuracy, and solve the long-term dependence problem.
- Summary
- Abstract
- Description
- Claims
- Application Information
AI Technical Summary
Problems solved by technology
Method used
Image


Examples
example
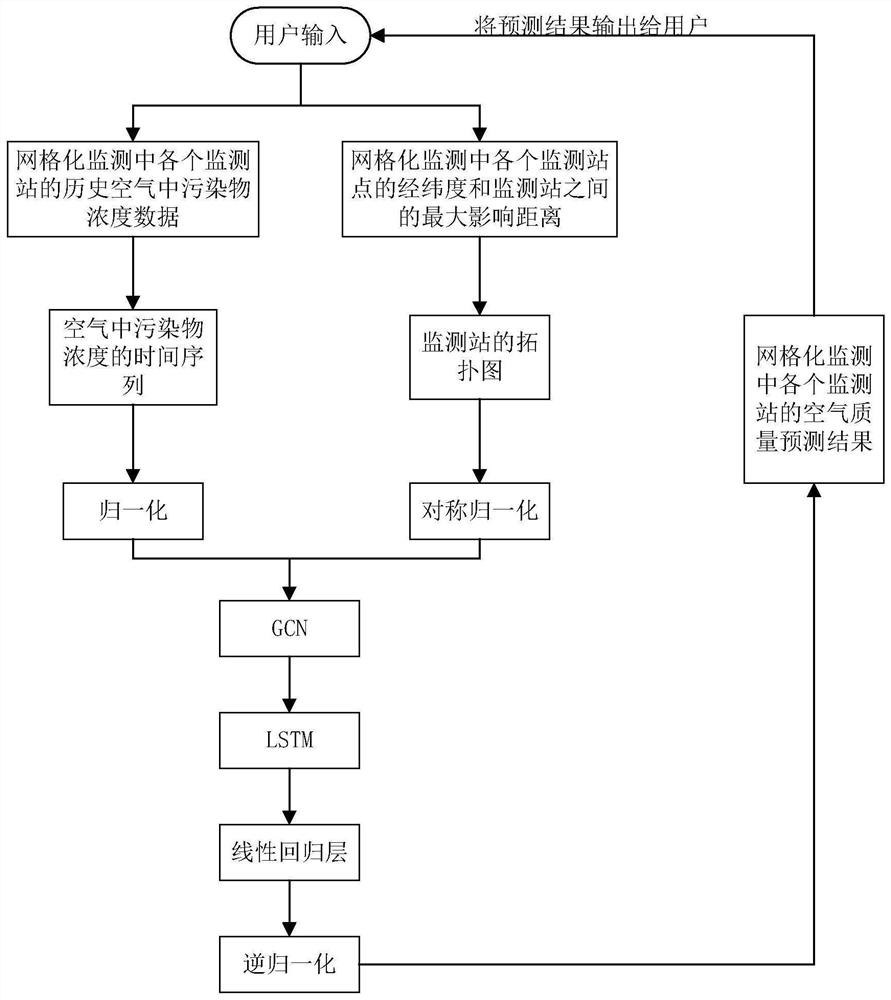
[0087] Enter as:
[0088] site longitude latitude Station A 123.556854 41.762261 Station B 123.525083 41.751233 Station C 123.439275 41.715011
[0089] First calculate the distance matrix between each site, and get the distance matrix as: (distance unit km)
[0090]
[0091] Then adjust the distance matrix according to the maximum influence distance k between the monitoring stations input by the user, assuming that the maximum influence distance k=9 (unit km) input by the user, then the adjusted matrix is:
[0092]
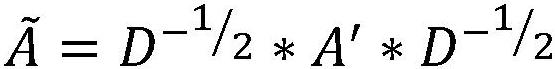
[0093] Then add a self-loop to the adjusted distance matrix to get the adjusted adjacency matrix:
[0094]
[0095] Step 4: This step is to map the time series matrix of pollutant concentration in the air obtained in step 2 to [0, 1], which is normalization.
[0096] Example:
[0097] Assuming the maximum air pollutant concentration x in the time series of transformed air pollutant concentrations in step two max ...
PUM
 Abstract
Description
Claims
Application Information