Investment portfolio generation system and method based on K-line graph and convolution auto-encoder
A technology of convolutional auto-encoder and generation system, which is applied in the field of portfolio generation system based on K-line graph and convolutional auto-encoder. and other issues to achieve the effect of increasing revenue and increasing revenue
- Summary
- Abstract
- Description
- Claims
- Application Information
AI Technical Summary
Problems solved by technology
Method used
Image
Examples
Embodiment 1
[0029] This embodiment provides a portfolio generation system based on K-line graph and convolutional autoencoder, including:
[0030] K-line chart generation module: used to obtain the stock market data of each stock in the window period closest to the current according to the set window period (20 days in this embodiment) and generate the K-line chart of each stock. Specifically, in this embodiment, the K-line chart is generated by using the daily lowest price, highest price, opening price, and closing price of each stock in the stock market in the last 20 days;
[0031] Feature extraction module: used to input the K-line chart of each stock into the convolutional autoencoder to obtain the deep feature representation of each K-line chart. In this embodiment, the convolutional autoencoder is constructed based on the structure of VGG16. VGG16 uses a multi-layer stacked 3*3 convolution kernel to replace the larger convolution kernel in AlexNet. Its advantage lies in the multi-l...
Embodiment 2
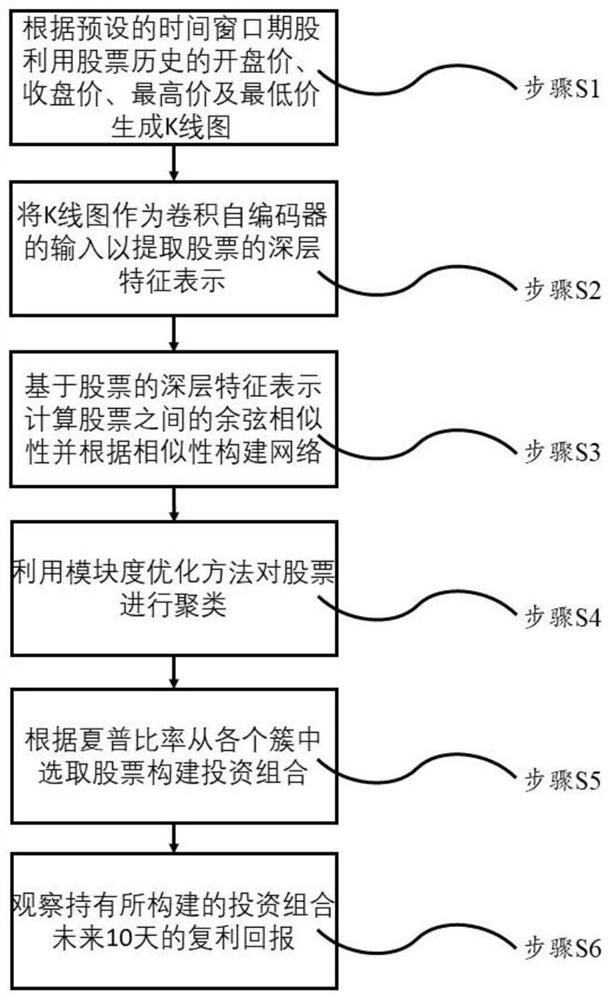
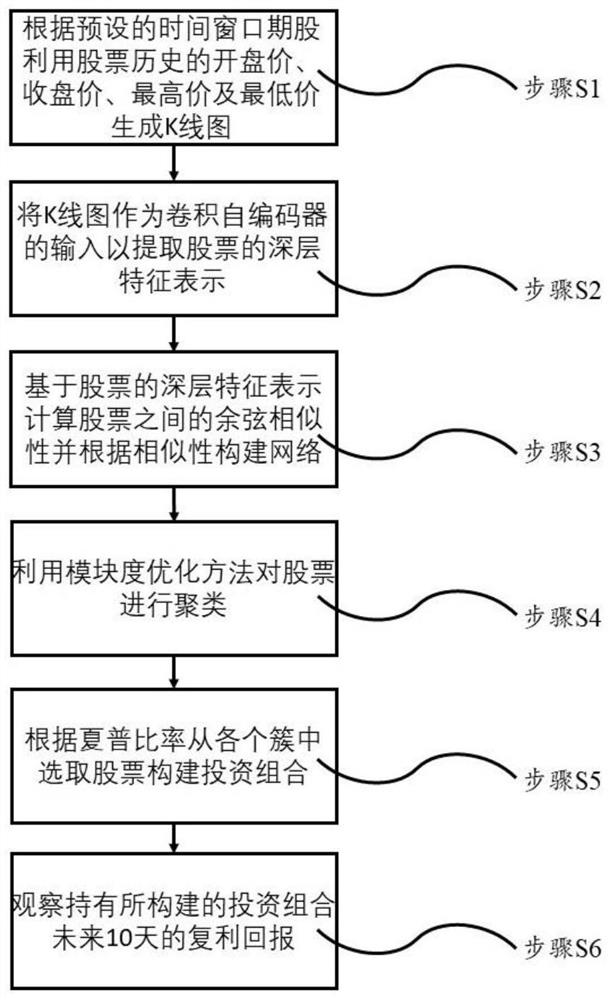
[0046] This embodiment provides a method for using the system described in Embodiment 1, such as figure 1 As shown, the specific process is:
[0047] S1. The K-line graph generation module obtains the stock market data of each stock in the nearest window period according to the set window period (20 days in this embodiment) and generates the K-line graph of each stock.
[0048] S2. The feature extraction module inputs the K-line chart of each stock into the convolutional autoencoder to obtain the deep feature representation of each K-line chart.
[0049] S3. The similarity calculation module regards each stock as a node, and calculates the cosine similarity between stocks according to the depth feature representation of the K-line graph of each stock obtained by the feature extraction module. The formula is as follows:
[0050]
[0051] where X i with X j are the eigenvector representations of two stocks i and j, respectively;
[0052] According to the cosine similarity...
PUM
 Abstract
Description
Claims
Application Information
 - R&D
- Intellectual Property
- Life Sciences
- Materials
- Tech Scout
- Unparalleled Data Quality
- Higher Quality Content
- 60% Fewer Hallucinations
Browse by: Latest US Patents, China's latest patents, Technical Efficacy Thesaurus, Application Domain, Technology Topic, Popular Technical Reports.
© 2025 PatSnap. All rights reserved.Legal|Privacy policy|Modern Slavery Act Transparency Statement|Sitemap|About US| Contact US: help@patsnap.com


