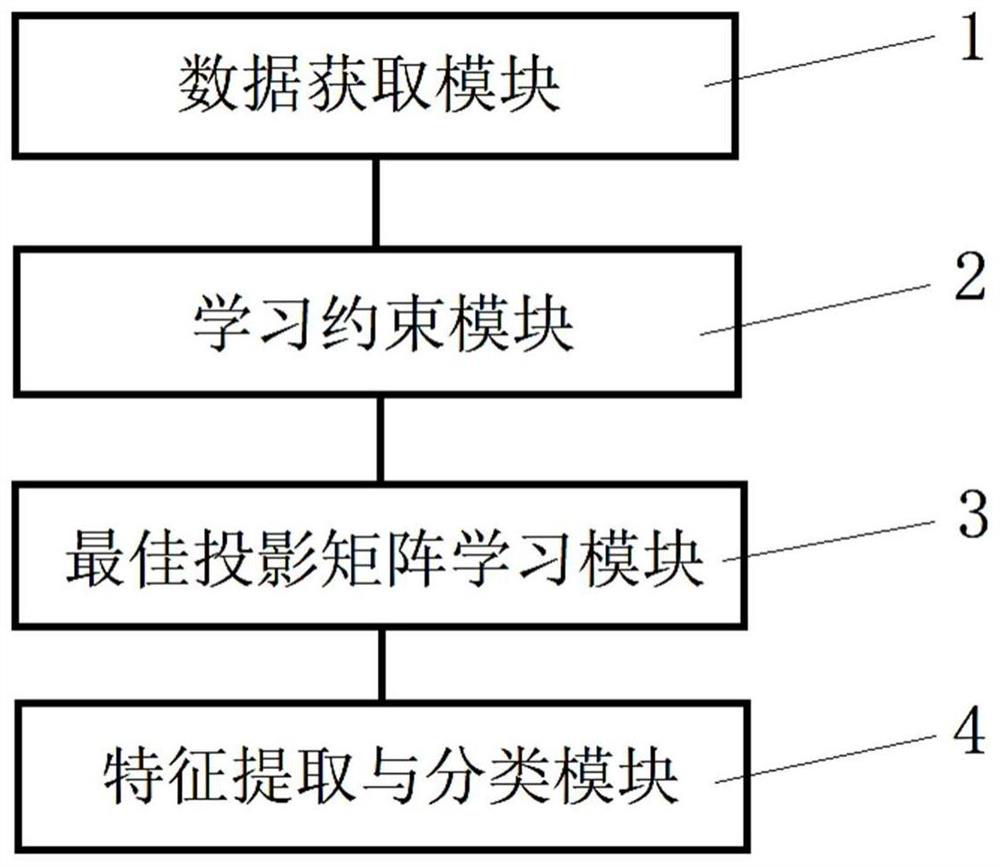
Adaptive graph constraint multi-view linear discriminant analysis method and system and storage medium
A linear discriminant analysis, multi-view technology, applied in instruments and other directions, can solve problems such as large computational complexity, difficulty in processing large data sets, and common subspaces that are not optimal solutions, to improve performance, avoid waste, and improve stability. and the effect of feature extraction performance
- Summary
- Abstract
- Description
- Claims
- Application Information
AI Technical Summary
Problems solved by technology
Method used
Image
Examples
Embodiment 1
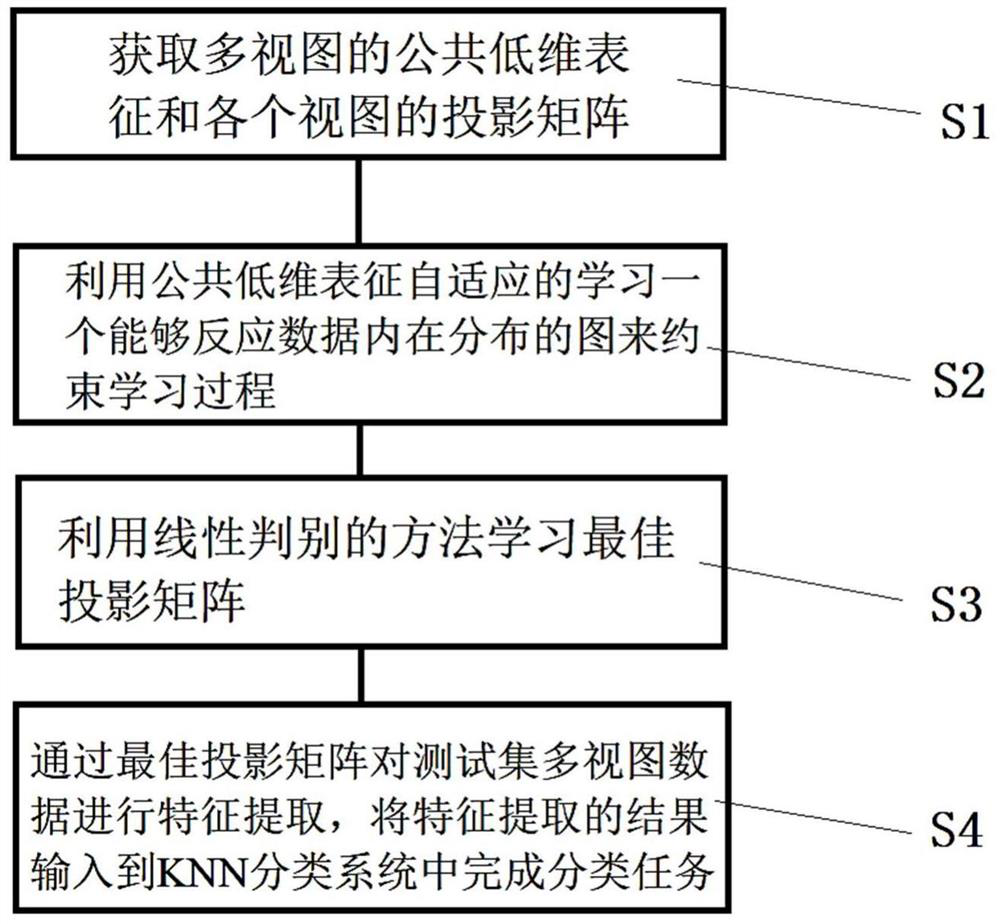
[0058] see figure 1 , the adaptive graph-constrained multi-view linear discriminant analysis method of the present invention comprises the following steps:
[0059] S1. Obtain the common low-dimensional representation of multiple views and the projection matrix of each view;
[0060] S2. Use a common low-dimensional representation to adaptively learn a graph that can reflect the internal distribution of the data to constrain the learning process;
[0061] S3, use the method of linear discrimination to learn the optimal projection matrix;
[0062] S4. Perform feature extraction on the multi-view data of the test set through the optimal projection matrix, and input the feature extraction result into the KNN classification system to complete the classification task.
[0063] In an optional implementation manner, step S1 obtains the common low-dimensional representation of the multi-views and the projection matrix of each view by maximizing the typical correlation coefficient be...
Embodiment 2
[0093] An adaptive graph-constrained multi-view linear discriminant analysis method according to an embodiment of the present invention includes the following steps:
[0094] given dataset The number of views of the dataset is M, represents the transformation matrix of the mth view, represents the data of the mth view, represents the common subspace shared by each view, D m Represents the number of dimensions of the mth view, d represents the dimension of S, L S is the graph Laplacian matrix, A is the affinity matrix corresponding to the Laplacian matrix LS.
[0095] It can be proved that linear discriminant analysis and least squares regression are equivalent, that is, expressing LDA as an equivalent LSR form can reduce the redundancy problem in the calculation process, which can be expressed as:
[0096]
[0097] In the multi-view linear discriminant analysis method with adaptive graph constraints, the MAXVAR representation of multi-view canonical correlation ana...
Embodiment 3
[0112] According to the adaptive graph-constrained multi-view linear discriminant analysis method proposed in Embodiment 2, the following steps are performed:
[0113] Step 1: Load the dataset and initialize the matrix S.
[0114] Step 2: Fix b and S, and update the projection matrix W.
[0115] Step 3: Fix W and S, and update the bias term b.
[0116] Step 4: Fix W and b, and update the covariance matrix S.
[0117]Step 5: Calculate U through the covariance matrix S m .
[0118] Step 6: Fix W, b, S, U m The value of , optimizes the affinity matrix A.
[0119] Step 7: Repeat steps 5 to 6 until W, b, S, U m , A converges.
[0120] Step 8: Use W, b, S, U m , A performs feature extraction on the original dataset.
[0121] Step 9: Use the KNN algorithm to classify the extracted features and calculate the classification result.
[0122] Step 10: Calculate the classification accuracy (ACC) according to the classification results.
[0123] Tables 1-6 show the experimenta...
PUM
 Abstract
Description
Claims
Application Information
 - R&D
- Intellectual Property
- Life Sciences
- Materials
- Tech Scout
- Unparalleled Data Quality
- Higher Quality Content
- 60% Fewer Hallucinations
Browse by: Latest US Patents, China's latest patents, Technical Efficacy Thesaurus, Application Domain, Technology Topic, Popular Technical Reports.
© 2025 PatSnap. All rights reserved.Legal|Privacy policy|Modern Slavery Act Transparency Statement|Sitemap|About US| Contact US: help@patsnap.com


