General type visual chart

An eye chart, a universal technology, applied in medical science, eye testing equipment, diagnosis, etc., can solve the problems of less than 5 meters, inconvenient conversion, inconvenient use, etc., achieves strong fairness, and is easy to record. and statistical analysis, the effect of simple structure

Inactive Publication Date: 2005-03-02
PLA NAVY GENERAL HOSIPTAL
View PDF0 Cites 8 Cited by
  • Summary
  • Abstract
  • Description
  • Claims
  • Application Information

AI Technical Summary

Problems solved by technology

However, it is inconvenient to convert these two vision recording methods at present.
[0004] In addition, the standard distance for traditional eye chart detection is 5 m

Method used


Image

  • General type visual chart
  • General type visual chart
  • General type visual chart

Examples


Embodiment 1

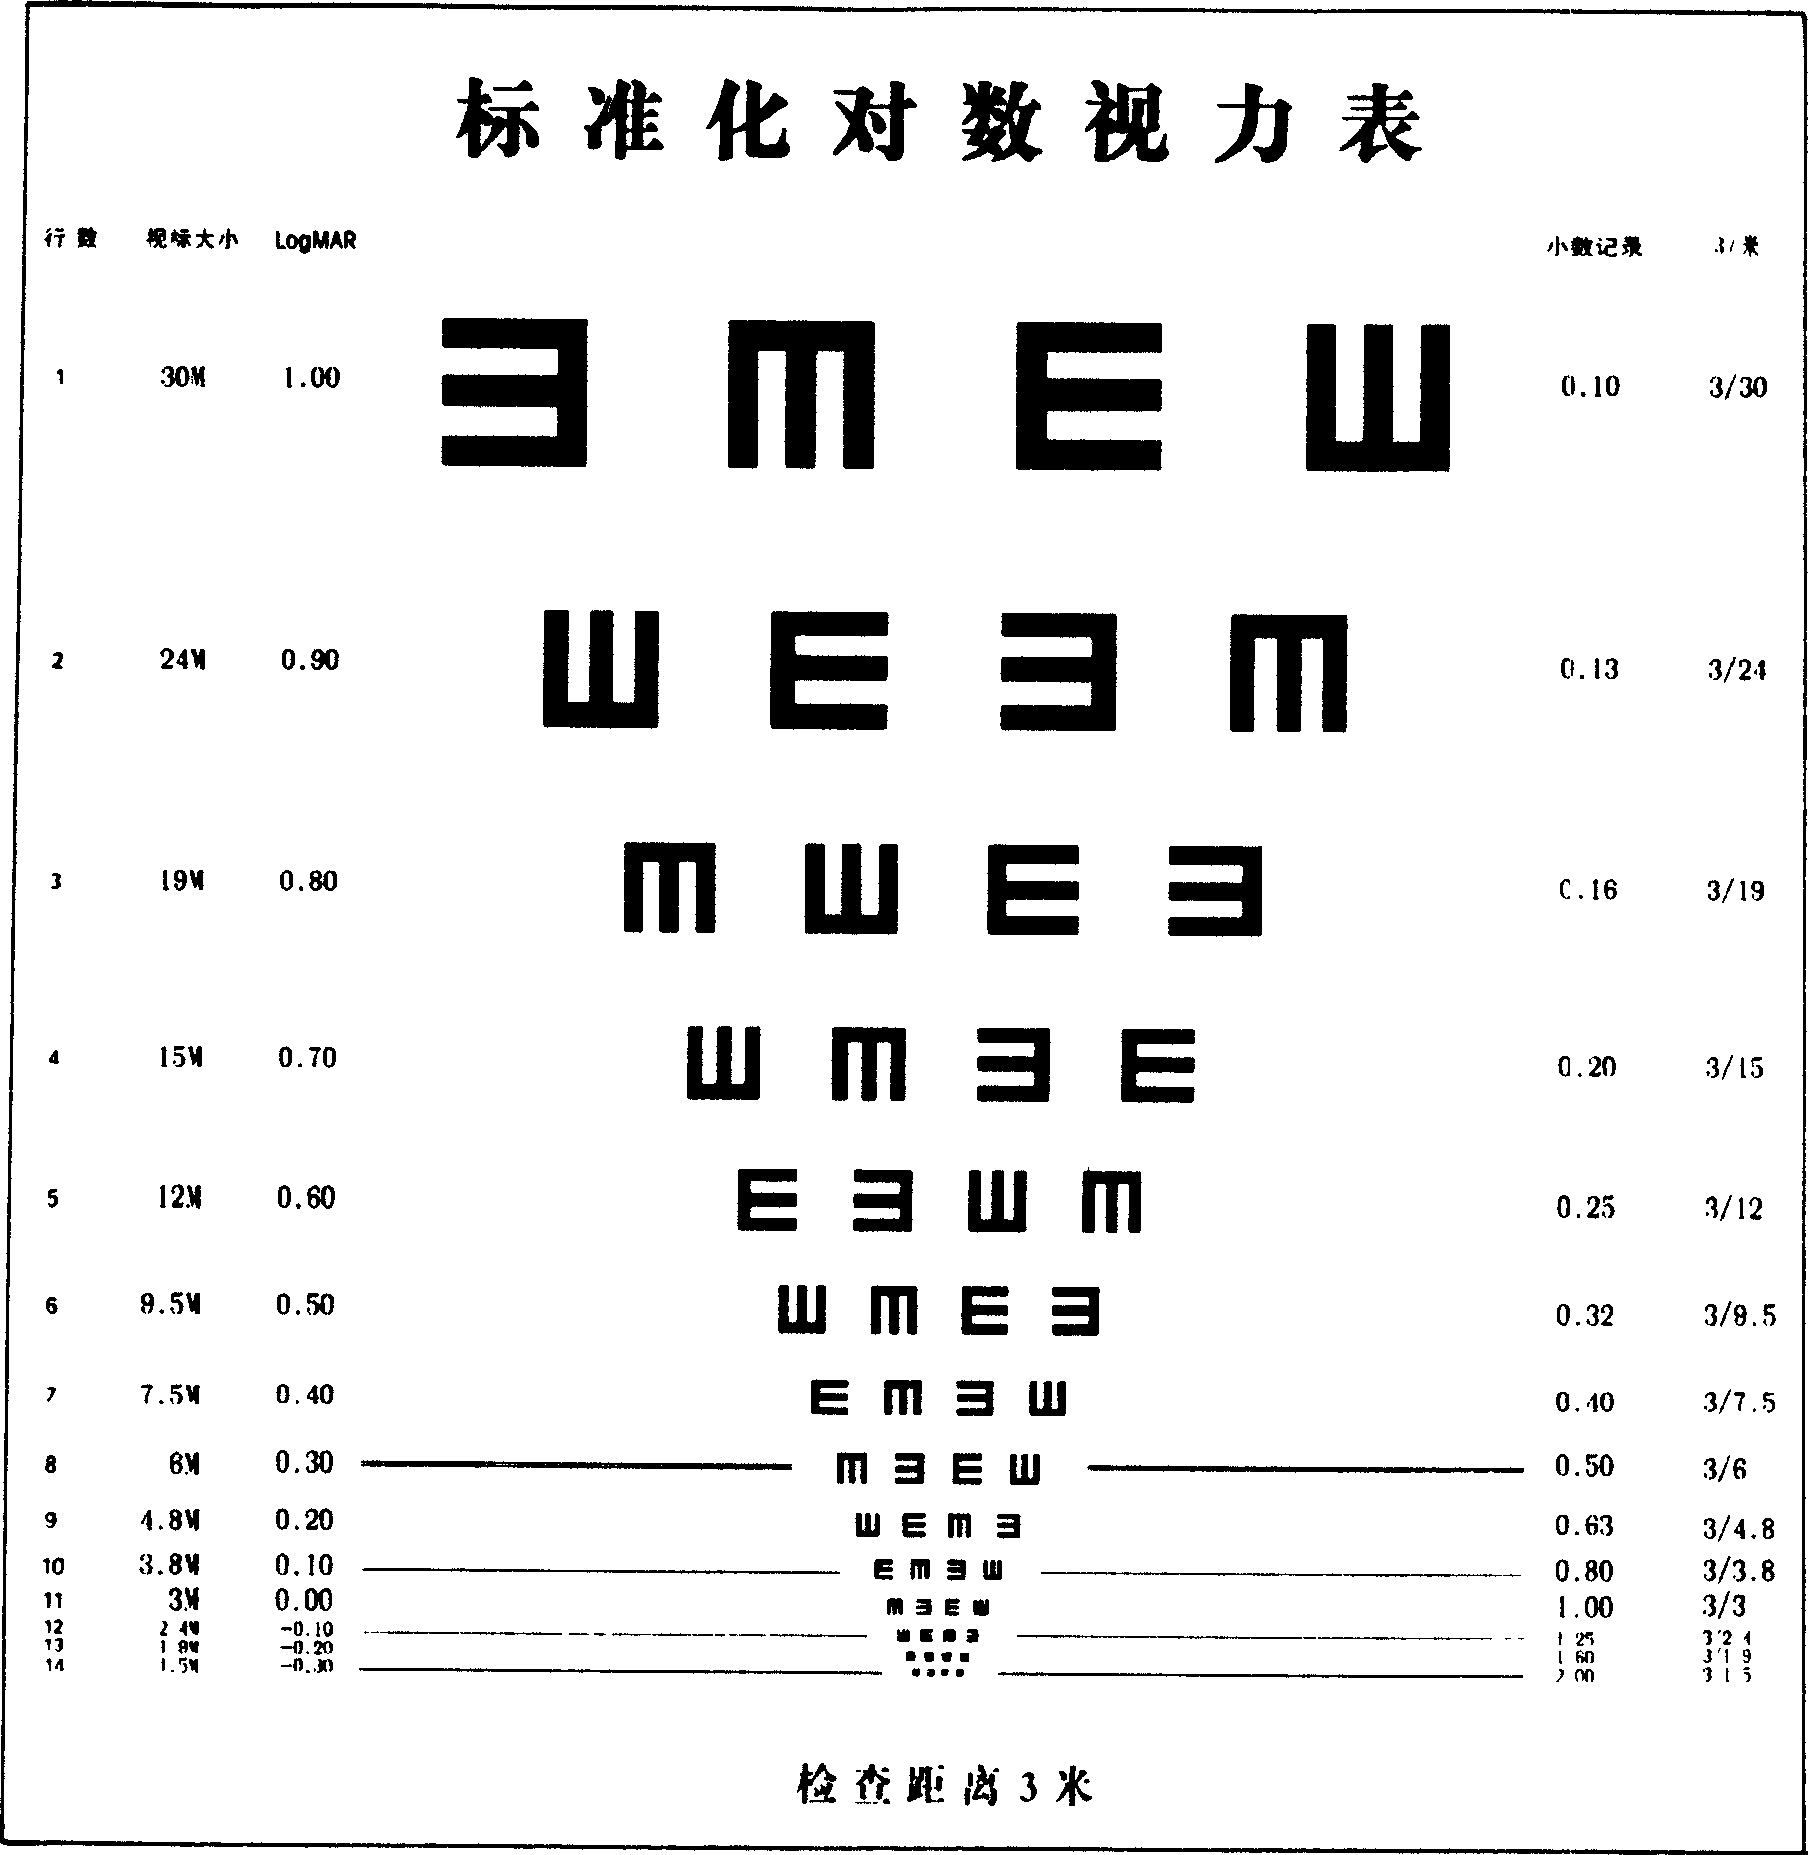
[0016] Embodiment one, such as figure 1 As shown, the 14 rows of E-shaped visual targets of the universal vision chart of the present invention are arranged in the middle along the vertical axis from large to small from top to bottom. Each visual target in each row has the same size and equal spacing. The 10th root of 10 increase rate arrangement. Each row is composed of 4 optotypes, which are up, down, left, and right, and their arrangement order in each row is irregular. The distance between each visual mark line and the next visual mark line is equal to the height of the visual mark in this line. The specified test distance is 3 meters. The corresponding decimal notation, logMAR notation and fractional notation values ​​are marked on both sides of each row of optotypes. The visual acuity chart is also equipped with a conversion table for logMAR visual acuity and fractional visual acuity.

Embodiment 2

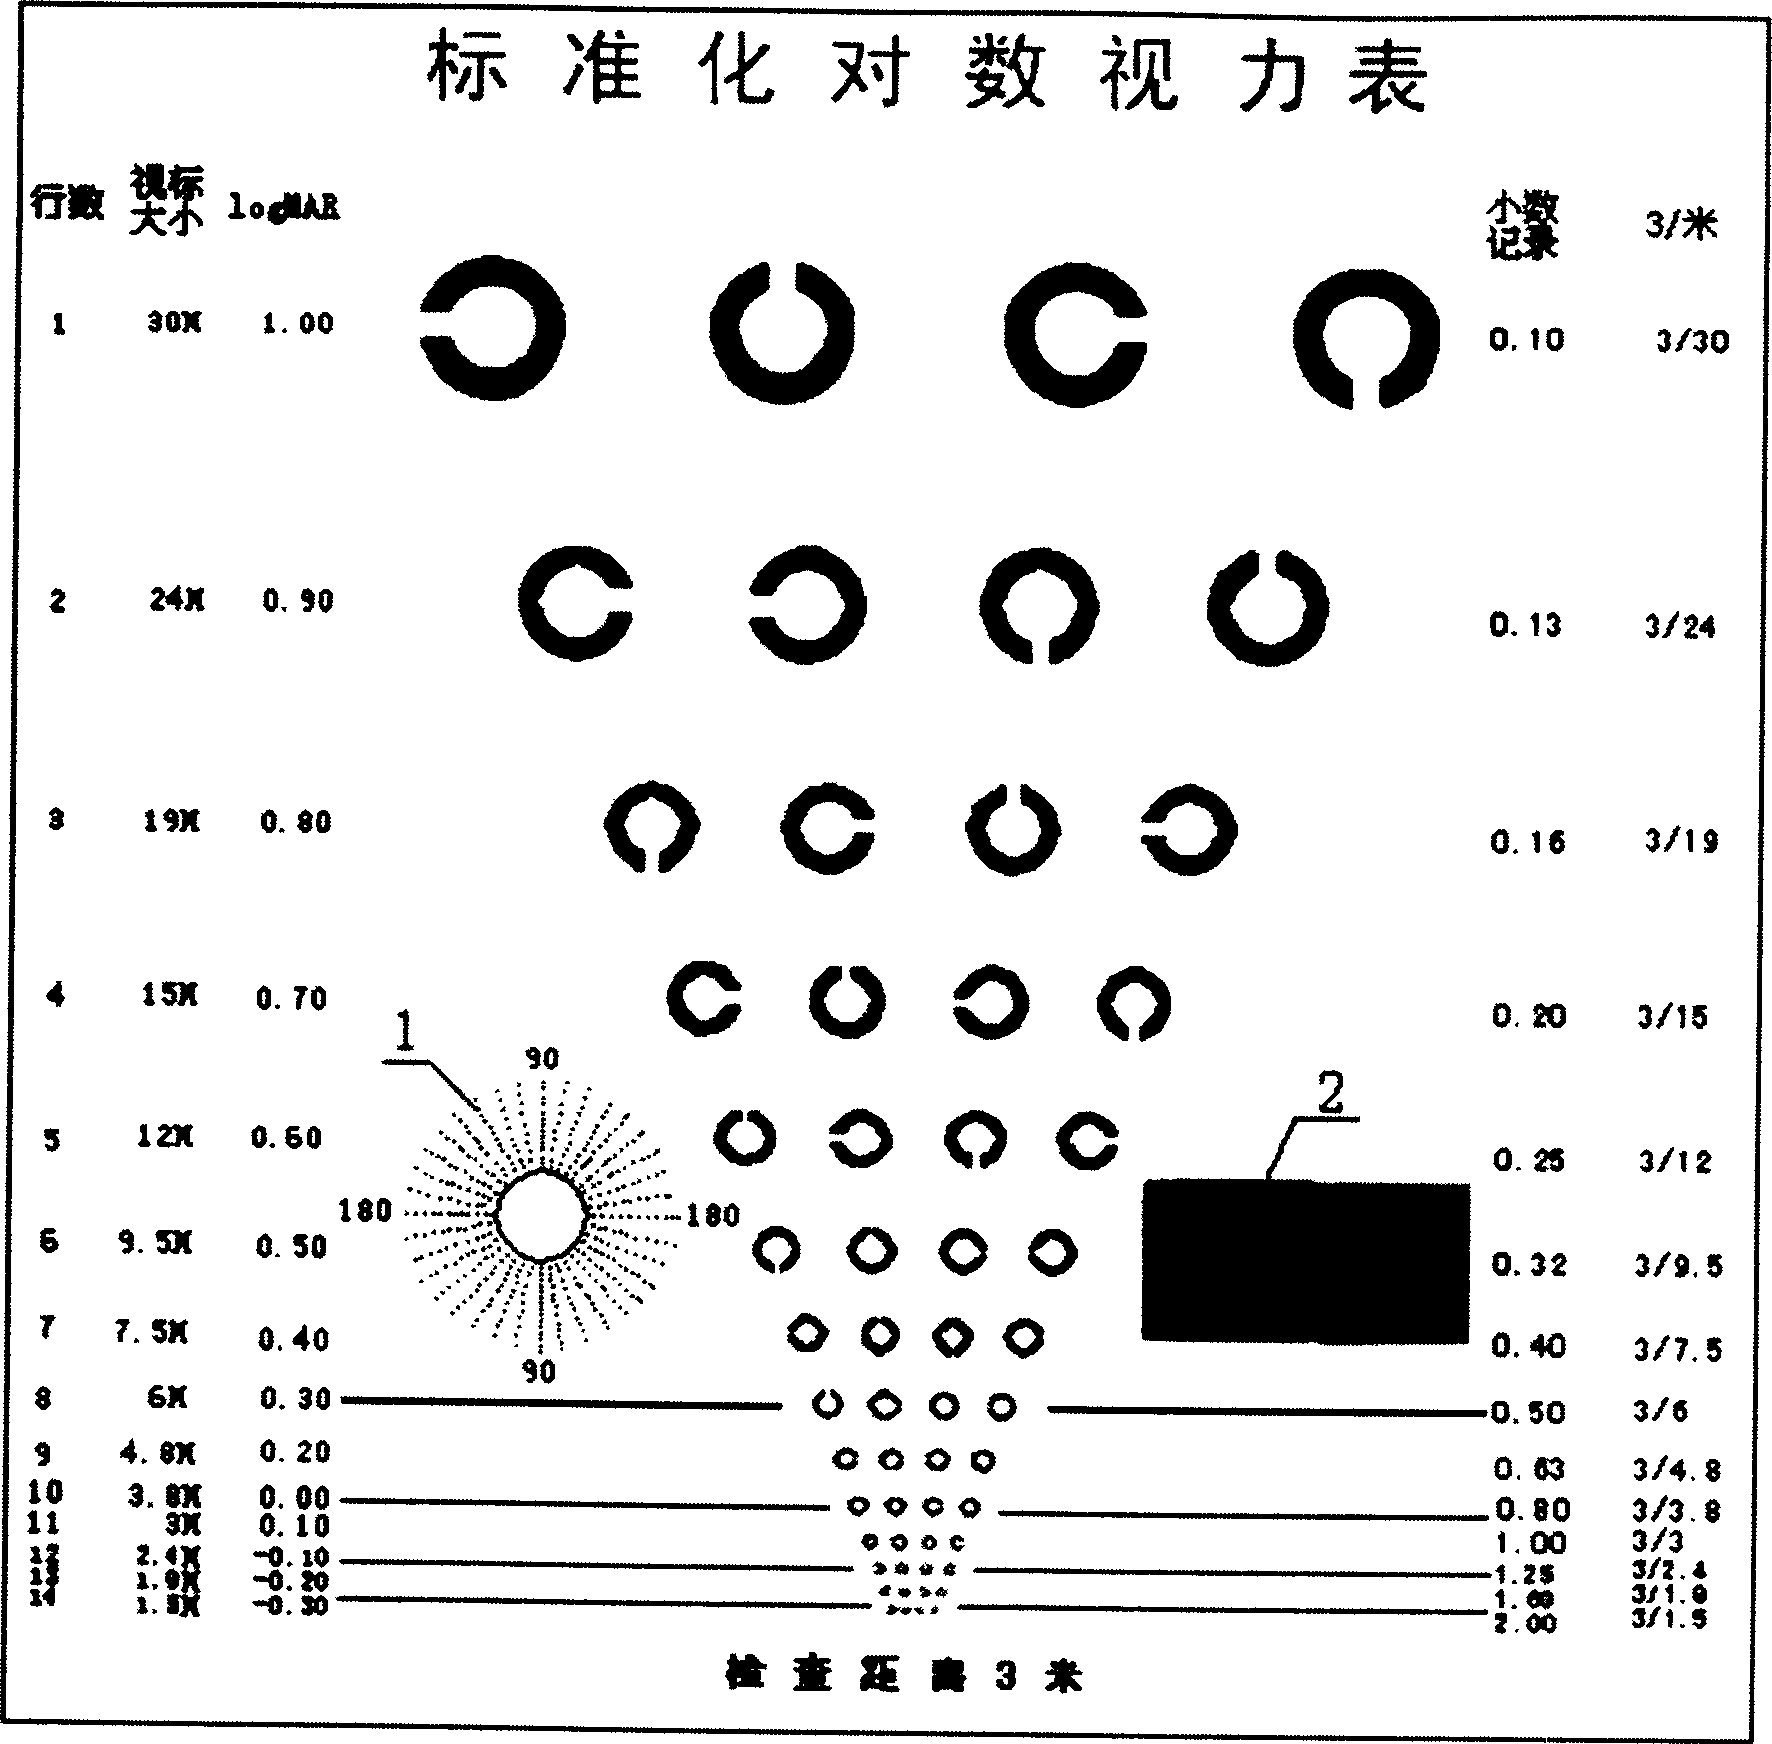
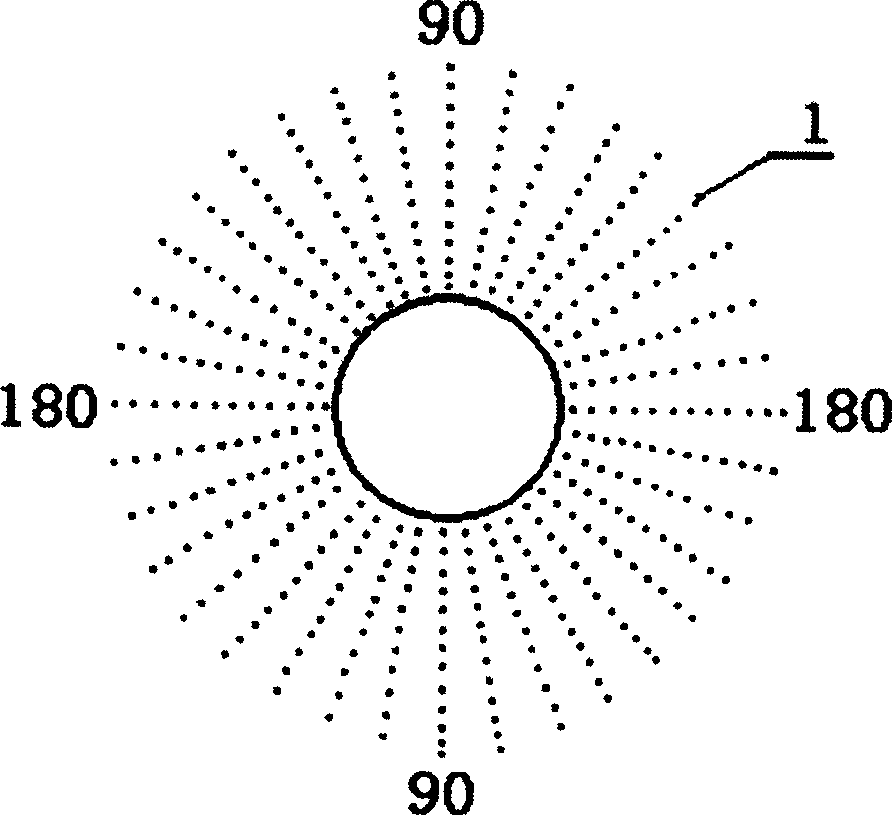
[0017] Embodiment two, such as figure 2 with 3 As shown, the 14 rows of C-shaped visual targets of the universal vision chart of the present invention are arranged in the middle along the vertical axis from large to small from top to bottom. Each visual target in each row has the same size and equal spacing. The 10th root of 10 increase rate arrangement. Each row is composed of 4 optotypes, which are up, down, left, and right, and their arrangement order in each row is irregular. The distance between each visual mark line and the next visual mark line is equal to the height of the visual mark in this line. The specified test distance is 3 meters. The corresponding decimal notation, logMAR notation and fractional notation values ​​are marked on both sides of each row of optotypes. The visual acuity chart is also equipped with a conversion table for logMAR visual acuity and fractional visual acuity. An astigmatism detection meter (1) and a farsightedness detection meter (2...


PUM


Abstract

The general type visual chart has several rows of visual marks arranged from top to bottom with large ones in the top side. Each row has 4 or 4n visual marks in different directions, including upwards, downwards, rightwards and leftwards, separately, with n being integral number. In addition, astigmatism detecting chart and myopia and hyperopia detecting chart may be also provided simultaneously for expanding the functions.

Description

technical field [0001] The invention relates to a vision detection device, in particular to a universal vision chart. Background technique [0002] At present, the commonly used vision charts in the medical field are "International Standard Vision Chart" and "Standard Logarithmic Vision Chart". The one that opens up and down is a horizontal sight mark, and the one that opens to the left and right is a vertical sight mark. In the "International Standard Vision Chart" and "Standard Logarithmic Vision Chart", the number of horizontal and vertical optotypes listed in some optotype rows is different. For example, in a row of five optotypes, horizontal Compared with the vertical visual standard, the visual standard is 3:2 or 2:3. Such a difference in visual targets will not cause detection errors for people with spherical ametropia, but it may cause detection errors for subjects with astigmatism (test eyes). When the number of horizontal visual targets is more than that of vert...

Claims


Application Information

Patent Timeline
IPC IPC(8): A61B3/032
Inventor 李刚颜少明张方华彭秀军
Owner PLA NAVY GENERAL HOSIPTAL
Why Eureka
Try Eureka