Method for analyzing EEG fluctuation signal and equipment thereof

一种信号分析方法、脑电信号的技术,应用在对脑电涨落信号进行分析领域,能够解决没有脑电信号分析、没有满足临床医疗提供依据的需要等问题

Inactive Publication Date: 2005-06-29
GUANGZHOU KEFU MEDICAL TECH
View PDF1 Cites 14 Cited by
  • Summary
  • Abstract
  • Description
  • Claims
  • Application Information

AI Technical Summary

Problems solved by technology

This patented technology raises the acquisition technology of EEG signals to a new level, but the device does not have the function of analyzing the collected EEG signals, and what can be presented to doctors is only the wave pattern of EEG, that is, EEG picture
As for how much useful information a doctor can obtain from an EEG for diagnosis, the doctor's personal ability to identify EEG patterns still does not meet the needs of providing evidence for clinical treatment.

Method used


Image

  • Method for analyzing EEG fluctuation signal and equipment thereof
  • Method for analyzing EEG fluctuation signal and equipment thereof
  • Method for analyzing EEG fluctuation signal and equipment thereof

Examples


Embodiment Construction

[0123] The present invention will be further described below in conjunction with accompanying drawing.

[0124] The implementation process of the present invention for analyzing EEG fluctuations is to use computer fluctuation scanning technology to extract EEG fluctuation signals from brain waves, and then perform spectrum analysis on the fluctuation signals to obtain power within the range of 1-255mHz. Spectrum. The specific analysis process can be summarized as follows: segment the EEG data of 1024 seconds into 2-second segments, and divide them into 512 segments; analyze the power spectrum of each segment of data, and select the maximum power amplitude within the range of 0.5-50 Hz; Perform power spectrum analysis on the time fluctuation process of the maximum power amplitude (that is, the maximum value of the power spectrum corresponding to 512 data segments), and obtain a power spectrum fluctuation diagram in the range of 1-255mHz.

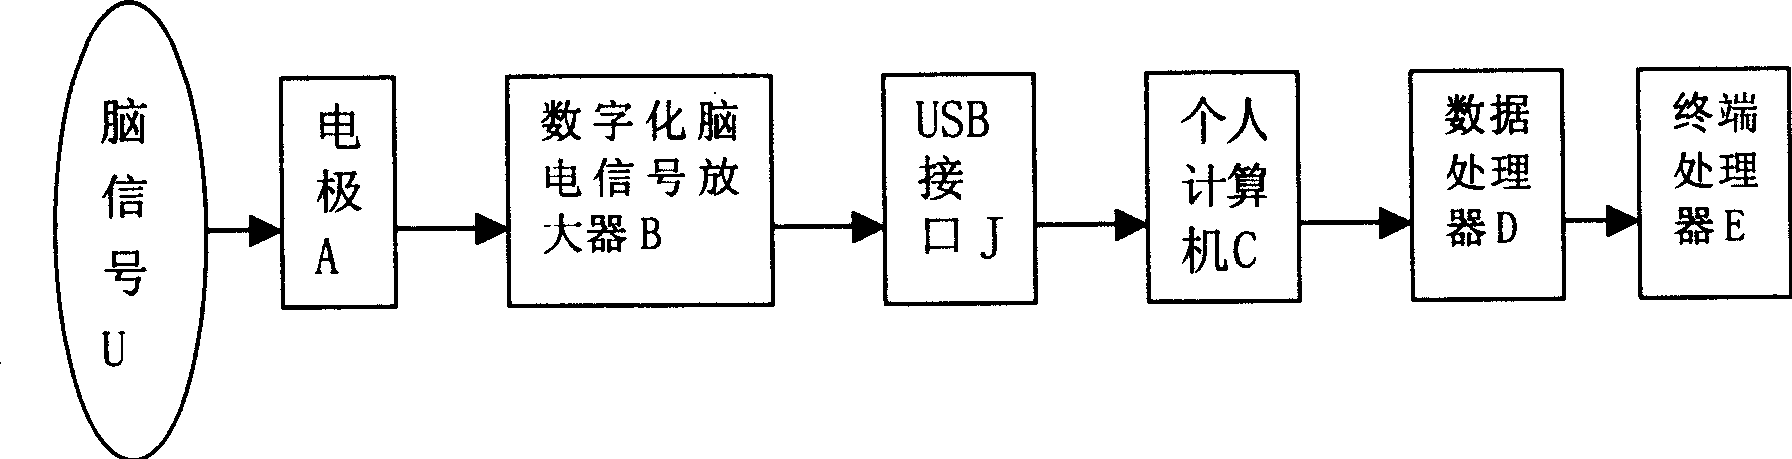
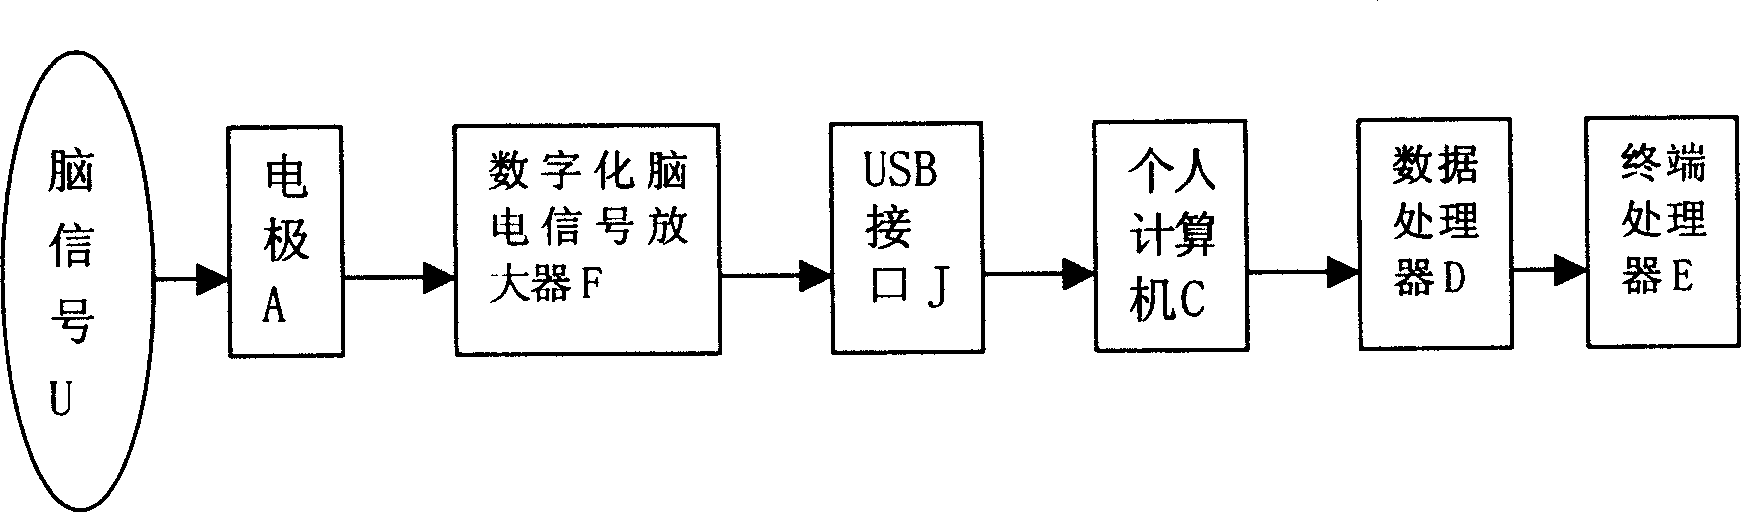
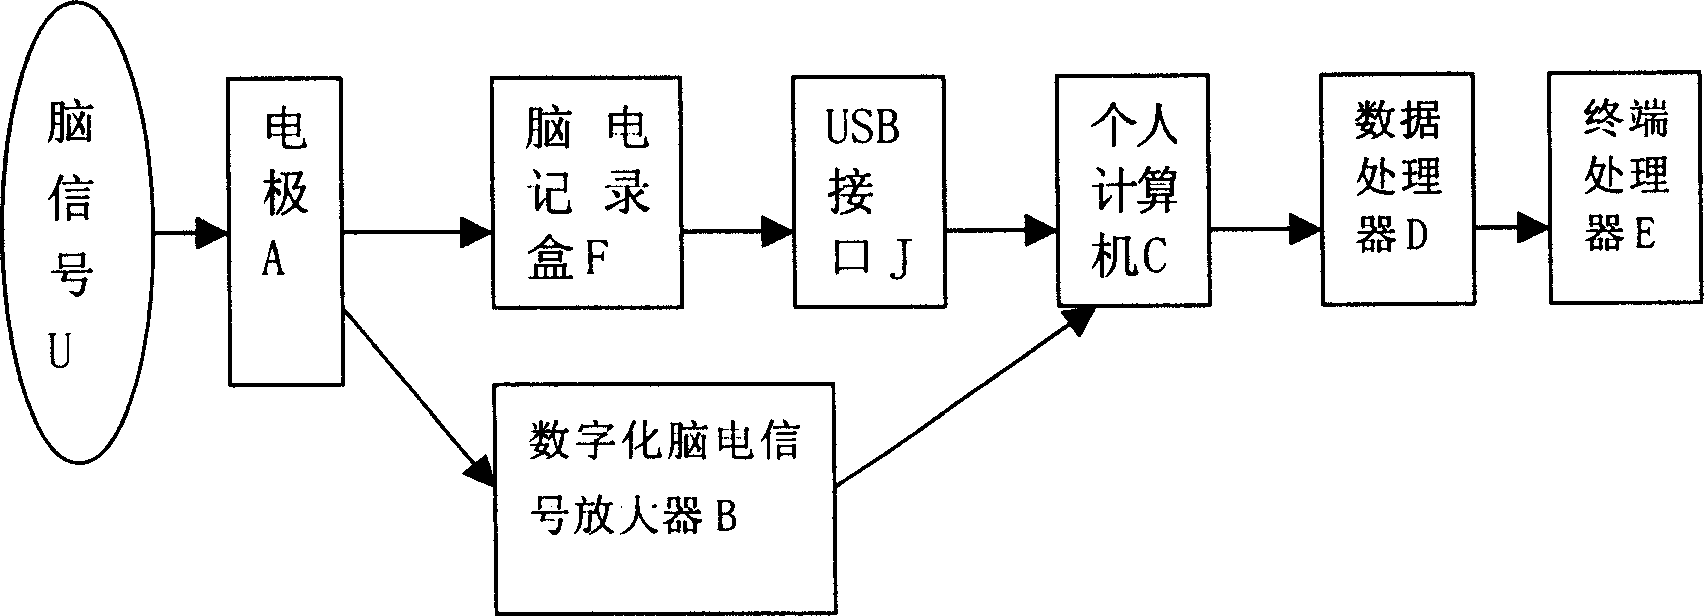
[0125] The composition of equipment o...


PUM


Abstract

This invention relates to a computer application technique to analyze the brain electricity signal for power spectrum to get a series of data parameters and provide basis for brain function test and disease dialogue. The analysis method comprises the regular power spectrum analysis, computer power fluctuating signal analysis, brain fluctuating graph analysis and S spectrum analysis and the further multi-project analysis. Its analysis device comprises electrode, brain signal amplifier device or brain recording box, personal computer, data processor and terminal processor.

Description

technical field [0001] The invention relates to the field of medical technical equipment for diagnosis, in particular to a method and equipment for analyzing brain electric fluctuation signals. Background technique [0002] Theoretically speaking, the physiological and pathological states of the human and animal brains, as well as the functional activities of the brain, can be known through the detection of EEG signals just like the electrocardiogram. There are two types of electroencephalographs currently used in medical treatment: analog signals and digital signals. However, because the EEG signal is very weak and complex, even a digital EEG with strong anti-interference is far from meeting the needs of clinical medicine, resulting in the diagnostic significance of EEG lagging behind that of EKG. [0003] Detecting and analyzing EEG fluctuation signals to judge brain function and diseases is the research result of China's aerospace medicine, and its clinical significance ...

Claims


Application Information

Patent Timeline
Patent Type & Authority Applications(China)
IPC IPC(8): A61B5/374
CPCA61B5/7253A61B5/7257A61B5/374
Inventor 徐建兰刘恩红
Owner GUANGZHOU KEFU MEDICAL TECH
Why Eureka
Try Eureka