
System and methods for processing and the visualization of bioaccoustical information

a bioaccoustical information and processing system technology, applied in seismology, seismology, instruments, etc., can solve the problems of inability to provide historical information that can place the contemporary, limited amount of data that can be offered to a viewer at any one time, and high cost of aerial surveys, etc., to achieve efficient analysis, efficient determination, and efficient showing

Active Publication Date: 2019-03-05
CORNELL UNIVERSITY
View PDF6 Cites 0 Cited by
  • Summary
  • Abstract
  • Description
  • Claims
  • Application Information

AI Technical Summary

Benefits of technology

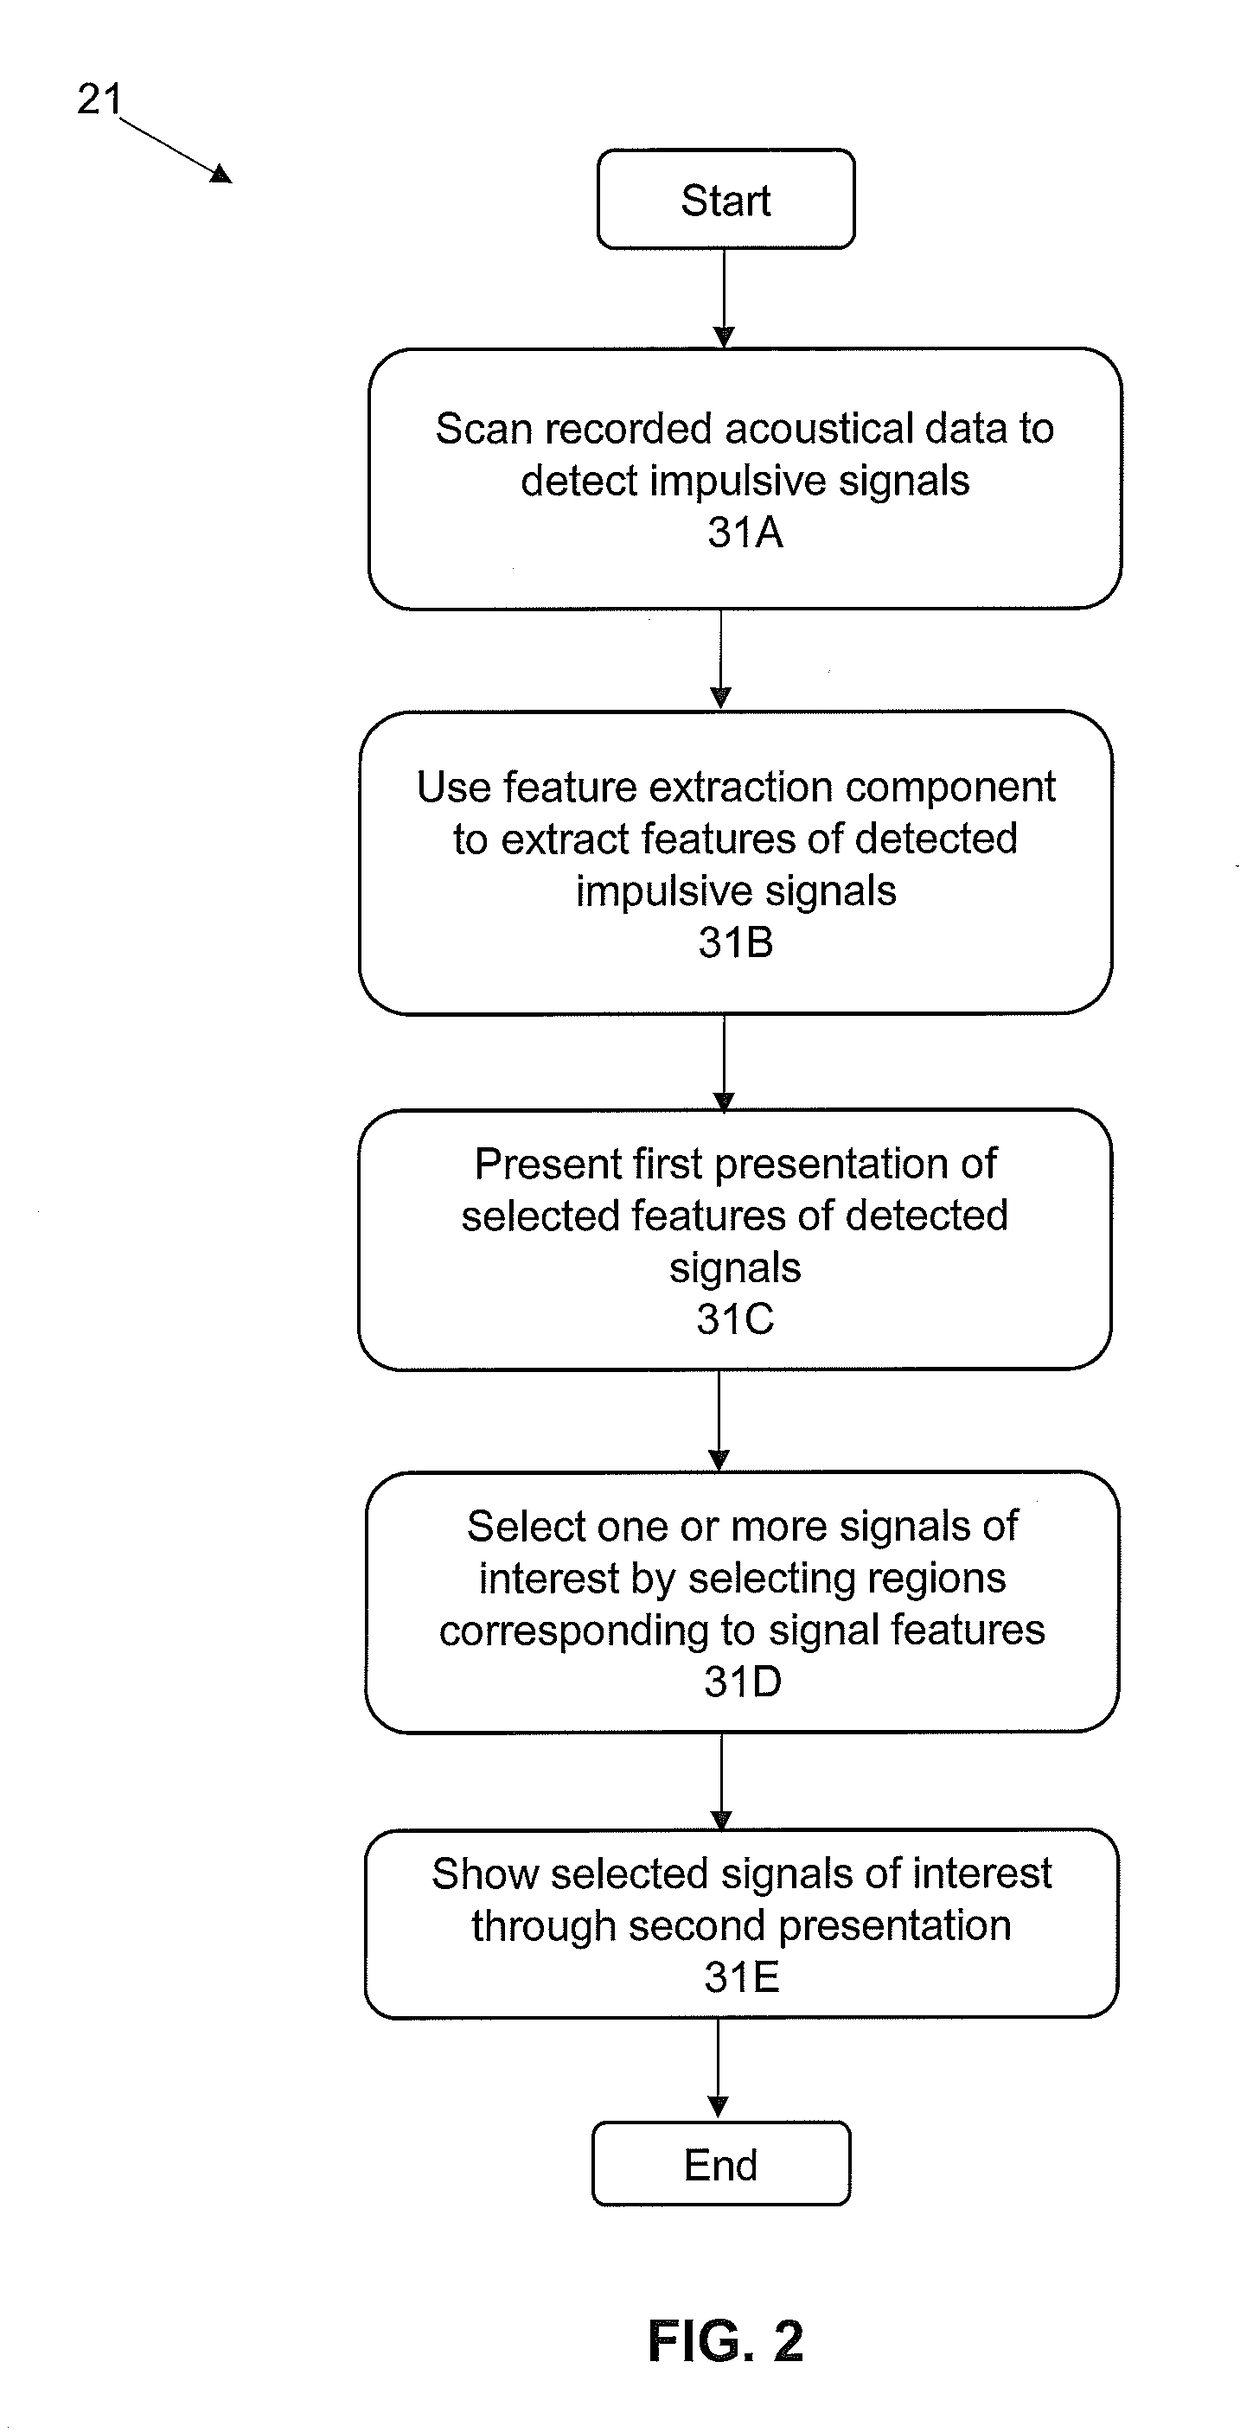
[0013]The present invention is directed to acoustics and signal processing. More specifically, the present invention is directed to a system and methods by which whether and the time during which one or more subjects are present within a given area of a marine or terrestrial ecosystem, and other information regarding the subjects can be efficiently determined by the sounds that the subjects produce. Advantageously, certain embodiments of the present invention permit a user to more rapidly analyze a large body of acoustic data recorded from the passive acoustic monitoring of an area and, through one or more visual presentations of the sounds, obtain additional information about the signals of interest.
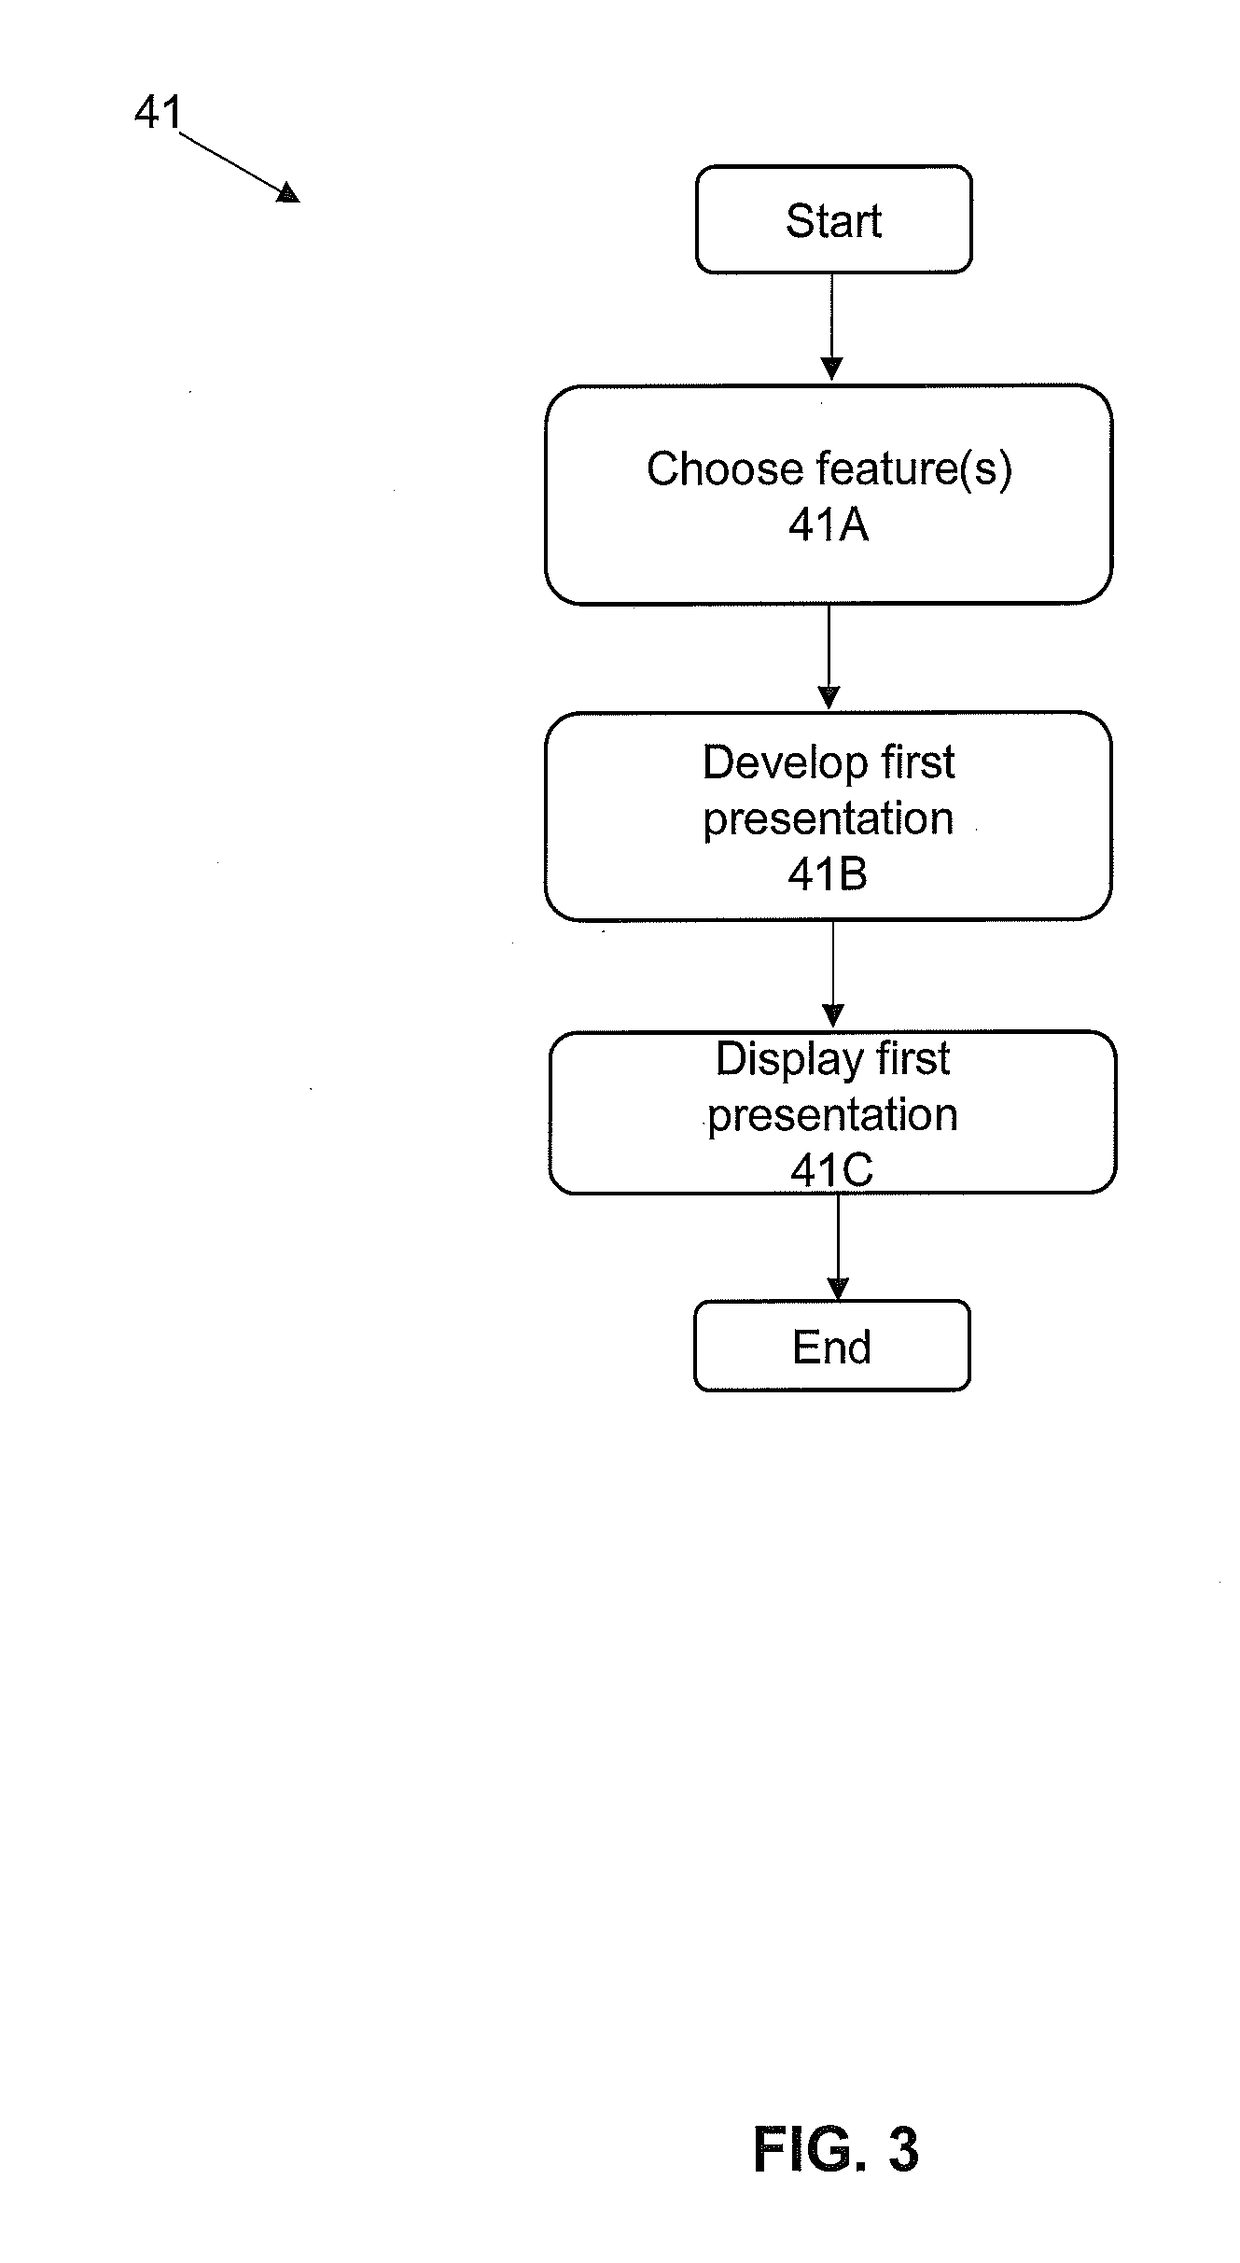
[0014]Certain embodiments of the present invention permit a user to define a signal of interest by the features of the signal such that the system can automatically produce a visual presentation of the data that is immediately accessible to the user. In a certain embodiment, the user may configure the system to select for signals of a certain range or classification such that the data is presented graphically in a two-dimensional histogram—in which the “y” axis is frequency or other selected signal feature and the “x” axis is time and in which the data is compressed such that a greater amount of time over which the data was received can be efficiently shown to the user. Through such a depiction, the user can readily see the period of time over which the sounds were received, the minimum frequency, the maximum frequency and other features of all detected sounds. The user can then select a certain area of feature shown on the histogram and the system will automatically produce one or more spectrograms in which all the detected signals that are within the selected area of feature are depicted.

Problems solved by technology

A variety of disadvantages are associated with such surveys.
For example, aerial surveys are costly, often provide information only during daylight hours, and, unless repeated, cannot provide historical information that can place the contemporary data in a larger context.
However, the data visualization and extraction techniques implemented in the existing commercial products often enable only a small portion of long-term data recordings—in some cases ten percent or less—to be processed with an acceptable accuracy and quality, given typical budgetary and times constraints.
However, spectrograms developed through the use of conventional data analysis systems take large portions of the typical screen used for the display of the spectrograms.
As a result, the amount of data that can be offered to a viewer at any one time is limited.
It is difficult also for a user to readily determine whether any pattern exists in the recorded data given that all the data is typically not shown on a single screen.

Method used


Image

  • System and methods for processing and the visualization of bioaccoustical information
  • System and methods for processing and the visualization of bioaccoustical information
  • System and methods for processing and the visualization of bioaccoustical information

Examples


Embodiment Construction

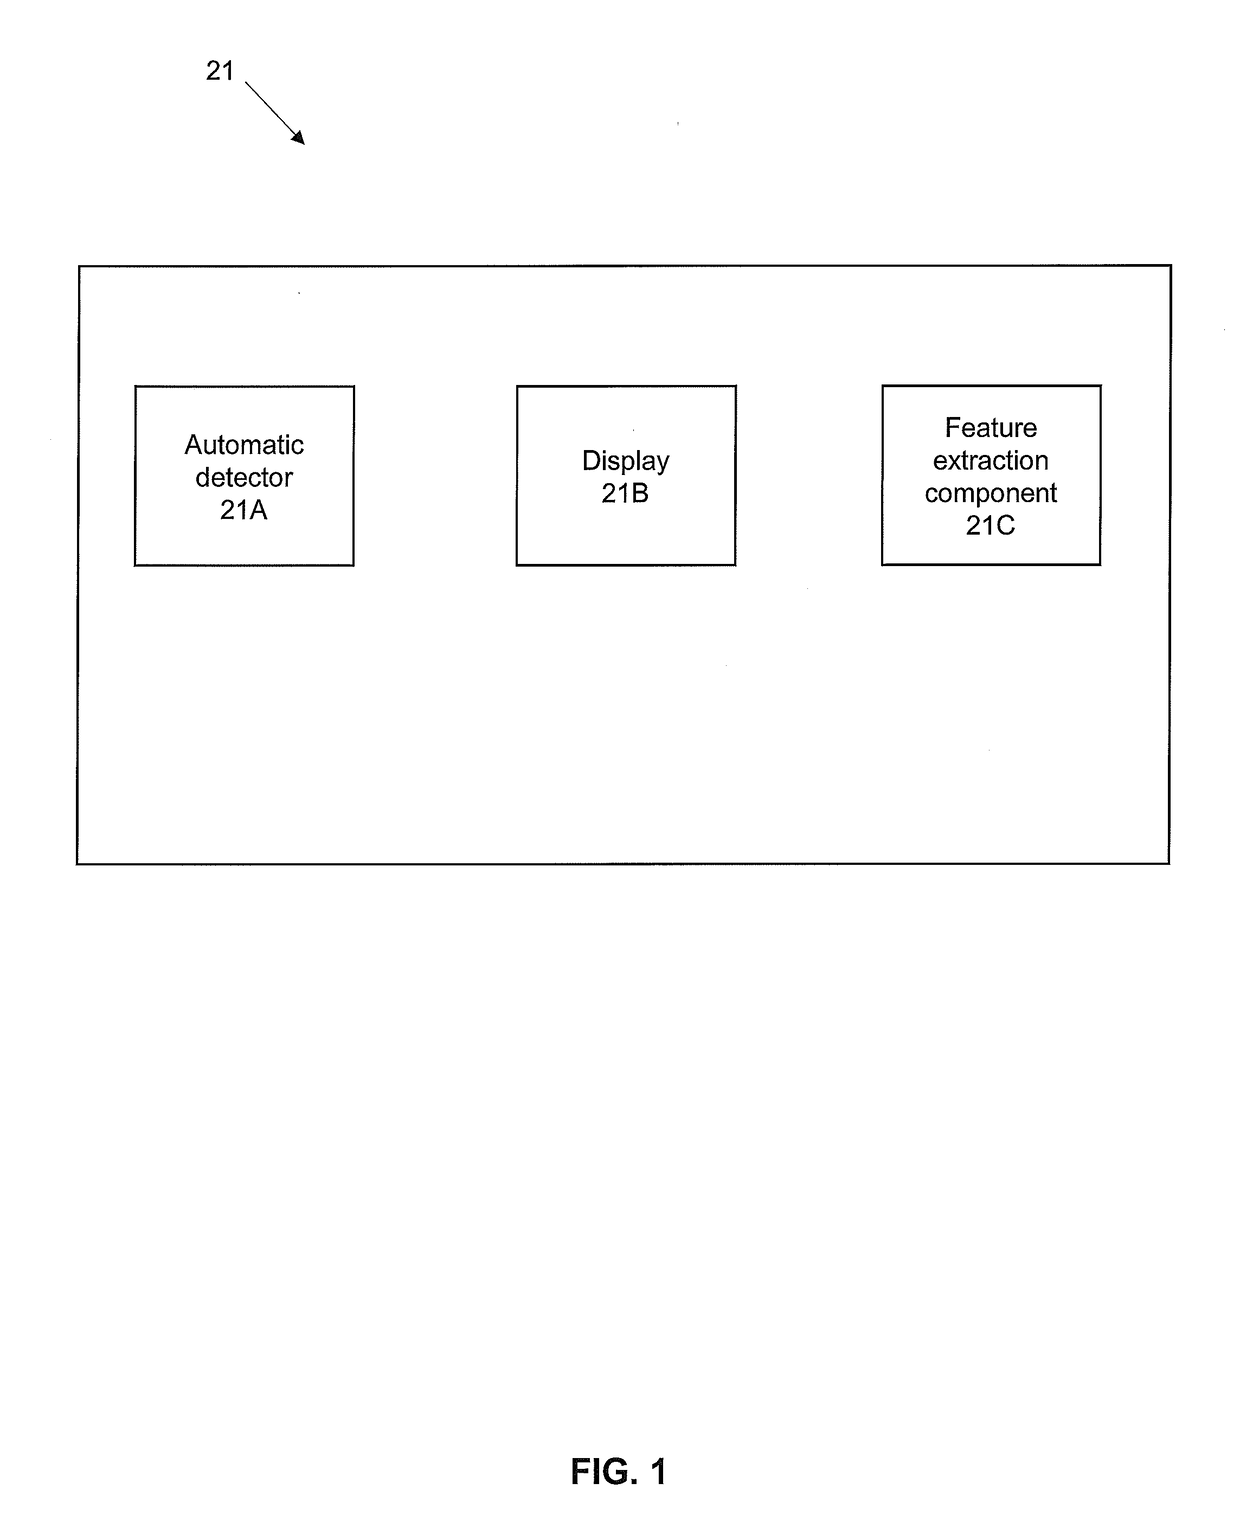
[0030]Certain preferred embodiments of a system—for facilitating the rapid analysis of a large body of acoustic data recorded from the passive acoustic monitoring of an area and, through one or more visual presentations of the sounds, obtain additional information about one or more the signals of interest—is identified in the Drawings by the number 21. Although a number of embodiments of the present invention will be described in the following, it is understood that these embodiments are presented by way of example only, not limitation. Accordingly, the detailed description of the exemplary embodiments of the invention should not be construed to limit the scope or breadth of the invention.

[0031]One preferred embodiment of the system 21 of the present invention is shown in FIG. 1. The illustrated embodiment of the system 21 illustrated in FIG. 1 includes an automatic detector 21A, a display 21B, and a feature extraction component 21C.

[0032]The operation of one embodiment of the syste...


PUM


Abstract

The present invention is directed to acoustics and signal processing. More specifically, the present invention is directed to a system and methods by which whether and the time during which one or more subjects are present within a given area of a marine or terrestrial ecosystem, and other information regarding the subjects can be efficiently determined by the sounds that the subjects produce. Advantageously, certain embodiments of the present invention permit a user to select and rapidly produce one or more visual presentations of the signals of interest (SOI) recorded from the passive acoustic monitoring of a given area of an ecosystem in order to obtain additional information about the subjects.

Description

CROSS-REFERENCE TO RELATED APPLICATIONS[0001]This application claims the benefit of U.S. Provisional Patent Application No. 61 / 894,504 filed Oct. 23, 2013, which is incorporated by reference.STATEMENT REGARDING FEDERALLY SPONSORED RESEARCH[0002]This invention was made with government support under DBI-1003220 awarded by the National Science Foundation (NSF). The government has certain rights in the invention.FIELD OF THE INVENTION[0003]The present invention is directed to acoustics and signal processing. More specifically, the present invention is directed to a system and methods by which whether and the time during which one or more subjects are present within a given area of a marine or terrestrial ecosystem, and other information regarding the subjects can be efficiently determined by the sounds that the subjects produce.[0004]Advantageously, certain embodiments of the present invention permit a user to select and rapidly produce one or more visual presentations of the signals of...

Claims


Application Information

Patent Timeline
Patent Type & Authority Patents(United States)
IPC IPC(8): G01V1/00G01V1/38
CPCG01V1/38G01V1/001
Inventor URAZGHILDIIEV, ILDAR
Owner CORNELL UNIVERSITY
Learn More