Change detection in medical images

a technology for change detection and medical images, applied in image enhancement, image analysis, healthcare informatics, etc., can solve the problems of insufficient accuracy of known automated change detection approaches, and achieve the effects of facilitating visualization and evaluation, facilitating review and evaluation of detected changes, and improving interpretation of changes

Active Publication Date: 2021-11-23
KONINKLJIJKE PHILIPS NV
View PDF24 Cites 0 Cited by
  • Summary
  • Abstract
  • Description
  • Claims
  • Application Information

AI Technical Summary

Benefits of technology

[0035]Advantageously, the above approach may allow delicate changes to be more accurately detected than change detection which is based on separately analyzing the intensities of the first and second medical image and subsequently detecting change, and the type of change, based on the outcome of such an image analysis.
[0037]Optionally, the processor is configured to determine intersection points between the plurality of probability distributions, and the plurality of intensity ranges are defined based on the intersection points. Intersection points between the plurality of probability distributions represent points where the probability of one probability function matches, and may then exceed that of another probability function. Effectively, the intersection points may be used to define ranges in which it is most likely that a variable, e.g., an intensity value of a pixel or voxel, belongs to a particular subpopulation. Using these intersection points may thus advantageously help to define the intensity ranges.
[0038]Optionally, the processor is configured to, before generating the difference image, perform at least one of: an image registration, and an intensity normalization, between the first medical image and the second medical image. Advantageously, the difference image may be generated more accurately when an image registration and / or an intensity normalization between the first medical image and the second medical image is performed beforehand. A more accurate generation of the difference image may advantageously result in a more accurate detection of the changes in the medical images.
[0039]Optionally, the processor is configured to, after generating the difference image, select at least one region of interest in the difference image, and determine the intensity distribution to selectively represent the intensity distribution of said at least one region of interest. As such, the determining of the intensity distribution and subsequent steps are only performed for part(s) of the difference image. By only performing said steps for part(s) of the image, the computational complexity of the change detection may be reduced. Optionally, the processor is configured to select the at least one region of interest in the difference image on the basis of the image data of the region of interest representing a non-zero difference. The change detection may thus be focused on regions of the difference image which may actually represent changes. It is noted that the selection of the region(s) of interest may comprise using of thresholding or similar techniques to identify region(s) of interest which represent changes which are considered to be significant.
[0042]Optionally, the processor is configured to generate an output image comprising a visualization of said labeling of the image data. Visualization of labeling in an output image may facilitate review and evaluation of the detected changes in the difference image. The output image may be output to an internal or external display for visualization. Alternatively, the labeling may be used for different, non-visual purposes, e.g., as input to a clinical decision support system, as input to an automatic classification algorithm, etc.
[0043]Optionally, the processor is configured to generate the visualization as an overlay over at least one of: the difference image, the first medical image and the second medical image. Such overlay may advantageously facilitate visualization and evaluation of the detected changes in the difference image, the first medical image and / or the second medical image. This may thus help a user to better interpret the changes.

Problems solved by technology

Disadvantageously, the known approaches to automated change detection are insufficiently accurate.

Method used


Image

  • Change detection in medical images
  • Change detection in medical images
  • Change detection in medical images

Examples


Embodiment Construction

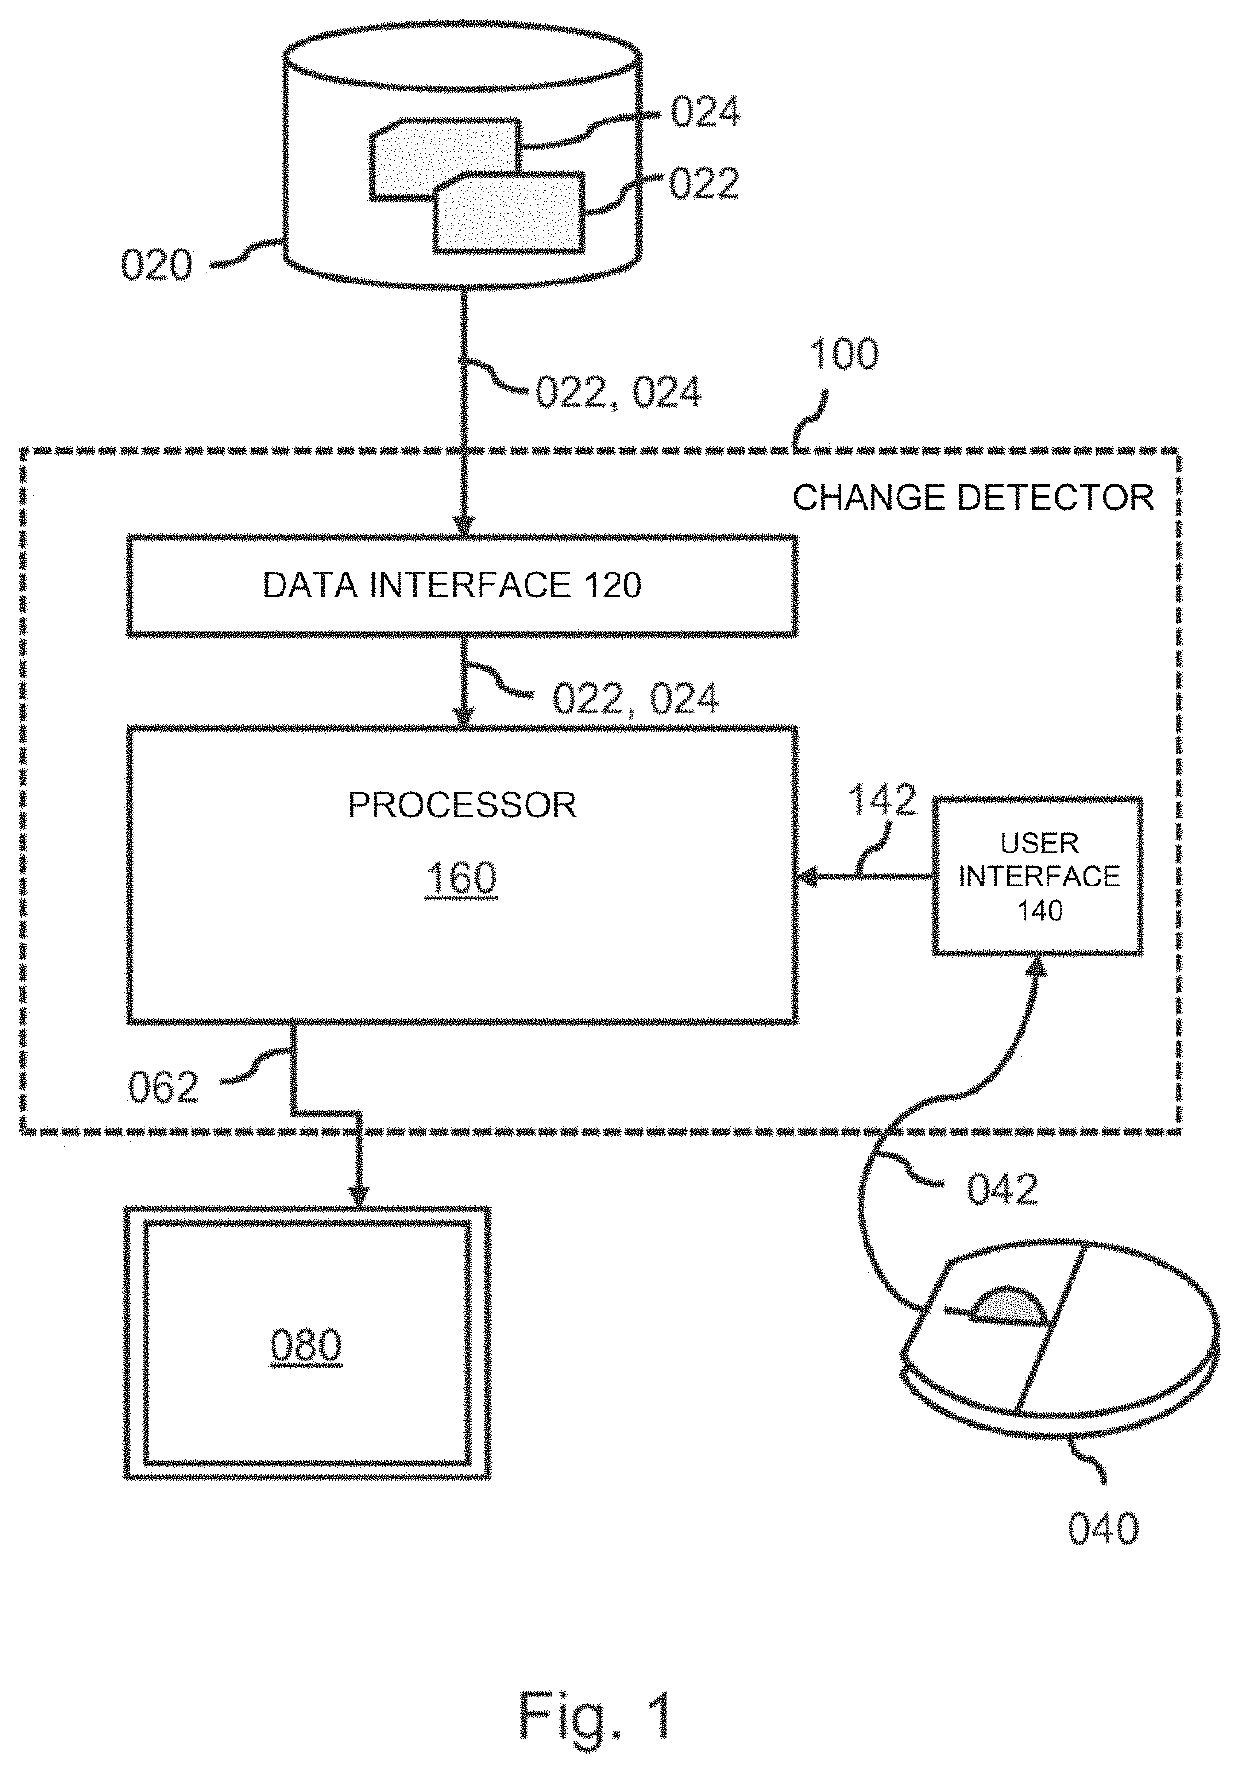
[0088]FIG. 1 shows a system 100 which is configured for change detection in medical images. The system 100 comprises an image data interface 120 configured to access a first medical image and a second medical image. In the example of FIG. 1, the image data interface 120 is shown to be connected to an external image repository 020 which comprises the image data of the first medical image 022 and the second medical image 024. For example, the image repository 020 may be constituted by, or be part of, a Picture Archiving and Communication System (PACS) of a Hospital Information System (HIS) to which the system 100 may be connected or comprised in. Accordingly, the system 100 may obtain access to the image data of the first medical image 022 and the second medical image 024 via the HIS. Alternatively, the image data of the first medical image and the second medical image may be accessed from an internal data storage of the system 100. In general, the image data interface 120 may take va...


PUM


Abstract

A difference image representing intensity differences between a first medical image and a second medical image is generated. A mixture model is fitted to an intensity distribution of the difference image to identify a plurality of probability distributions which collectively model the intensity distribution. A plurality of intensity ranges is determined as a function of the plurality of probability distributions. Image data of the difference image is labeled by determining into which of the plurality of intensity ranges said labeled image data falls. This technique more accurately details changes in medical images than known systems and methods.

Description

[0001]This application is the U.S. National Phase application under 35 U.S.C. § 371 of International Application No. PCT / EP2017 / 066130, filed on Jun. 29, 2017, which claims the benefit of European Application Serial No. 16176819.7, filed Jun. 29, 2016. These applications are hereby incorporated by reference herein.FIELD OF THE INVENTION[0002]The invention relates to a system and a method for change detection in medical images. The invention further relates to a server, imaging apparatus and workstation comprising the system. The invention further relates to a computer readable medium comprising instructions to cause a processor system to perform the method.BACKGROUND OF THE INVENTION[0003]Medical images may show an anatomical structure of a patient and / or functional properties of the underlying tissue. It may be desirable to detect changes in (part of) the anatomical structure of the patient, or in the functional properties of the underlying tissue. Such changes may denote a change ...

Claims


Application Information

Patent Timeline
Patent Type & Authority Patents(United States)
IPC IPC(8): G06T7/00G06T7/136
CPCG06T7/0016G06T7/136G06T2207/20076G06T2207/20224G16H30/00
Inventor SCHIRMAN, TAMAR DEBORAYEHEZKELY, SHELLY THEODORAKAM, YOSSISHAKIRIN, GEORGYTHIELE, FRANK OLAFKATZ, RUTH
Owner KONINKLJIJKE PHILIPS NV
Why Eureka
Try Eureka