Method of removing abnormal data and blood component spectroscopy analysis system employing the same

a technology of abnormal data and analysis system, applied in the field of blood component analysis system, can solve the problems of long measuring time, abnormal data, and errors in the analysis of blood components using spectroscopy

Inactive Publication Date: 2004-10-14
SAMSUNG ELECTRONICS CO LTD
View PDF10 Cites 121 Cited by
  • Summary
  • Abstract
  • Description
  • Claims
  • Application Information

AI Technical Summary

Problems solved by technology

The measurement of a vital signal using a non-invasive method is an important issue in the field of current medical engineering, and methods of measuring various physiological variables have been developed.
These changes in the amplitude of the pulsatile component and the base line of the PPG signal due to an internal factor causes abnormal data.
As a result, errors occur in the analysis of a blood component using spectroscopy.
Further, many current techniques require separate hardware to measure the external factors.
Finally, in these current techniques, a physiological signal such as an oxygen saturation signal is measured after a predetermined time has passed until a patient becomes physiologically stable, and therefore, a lengthy measuring time is required.

Method used

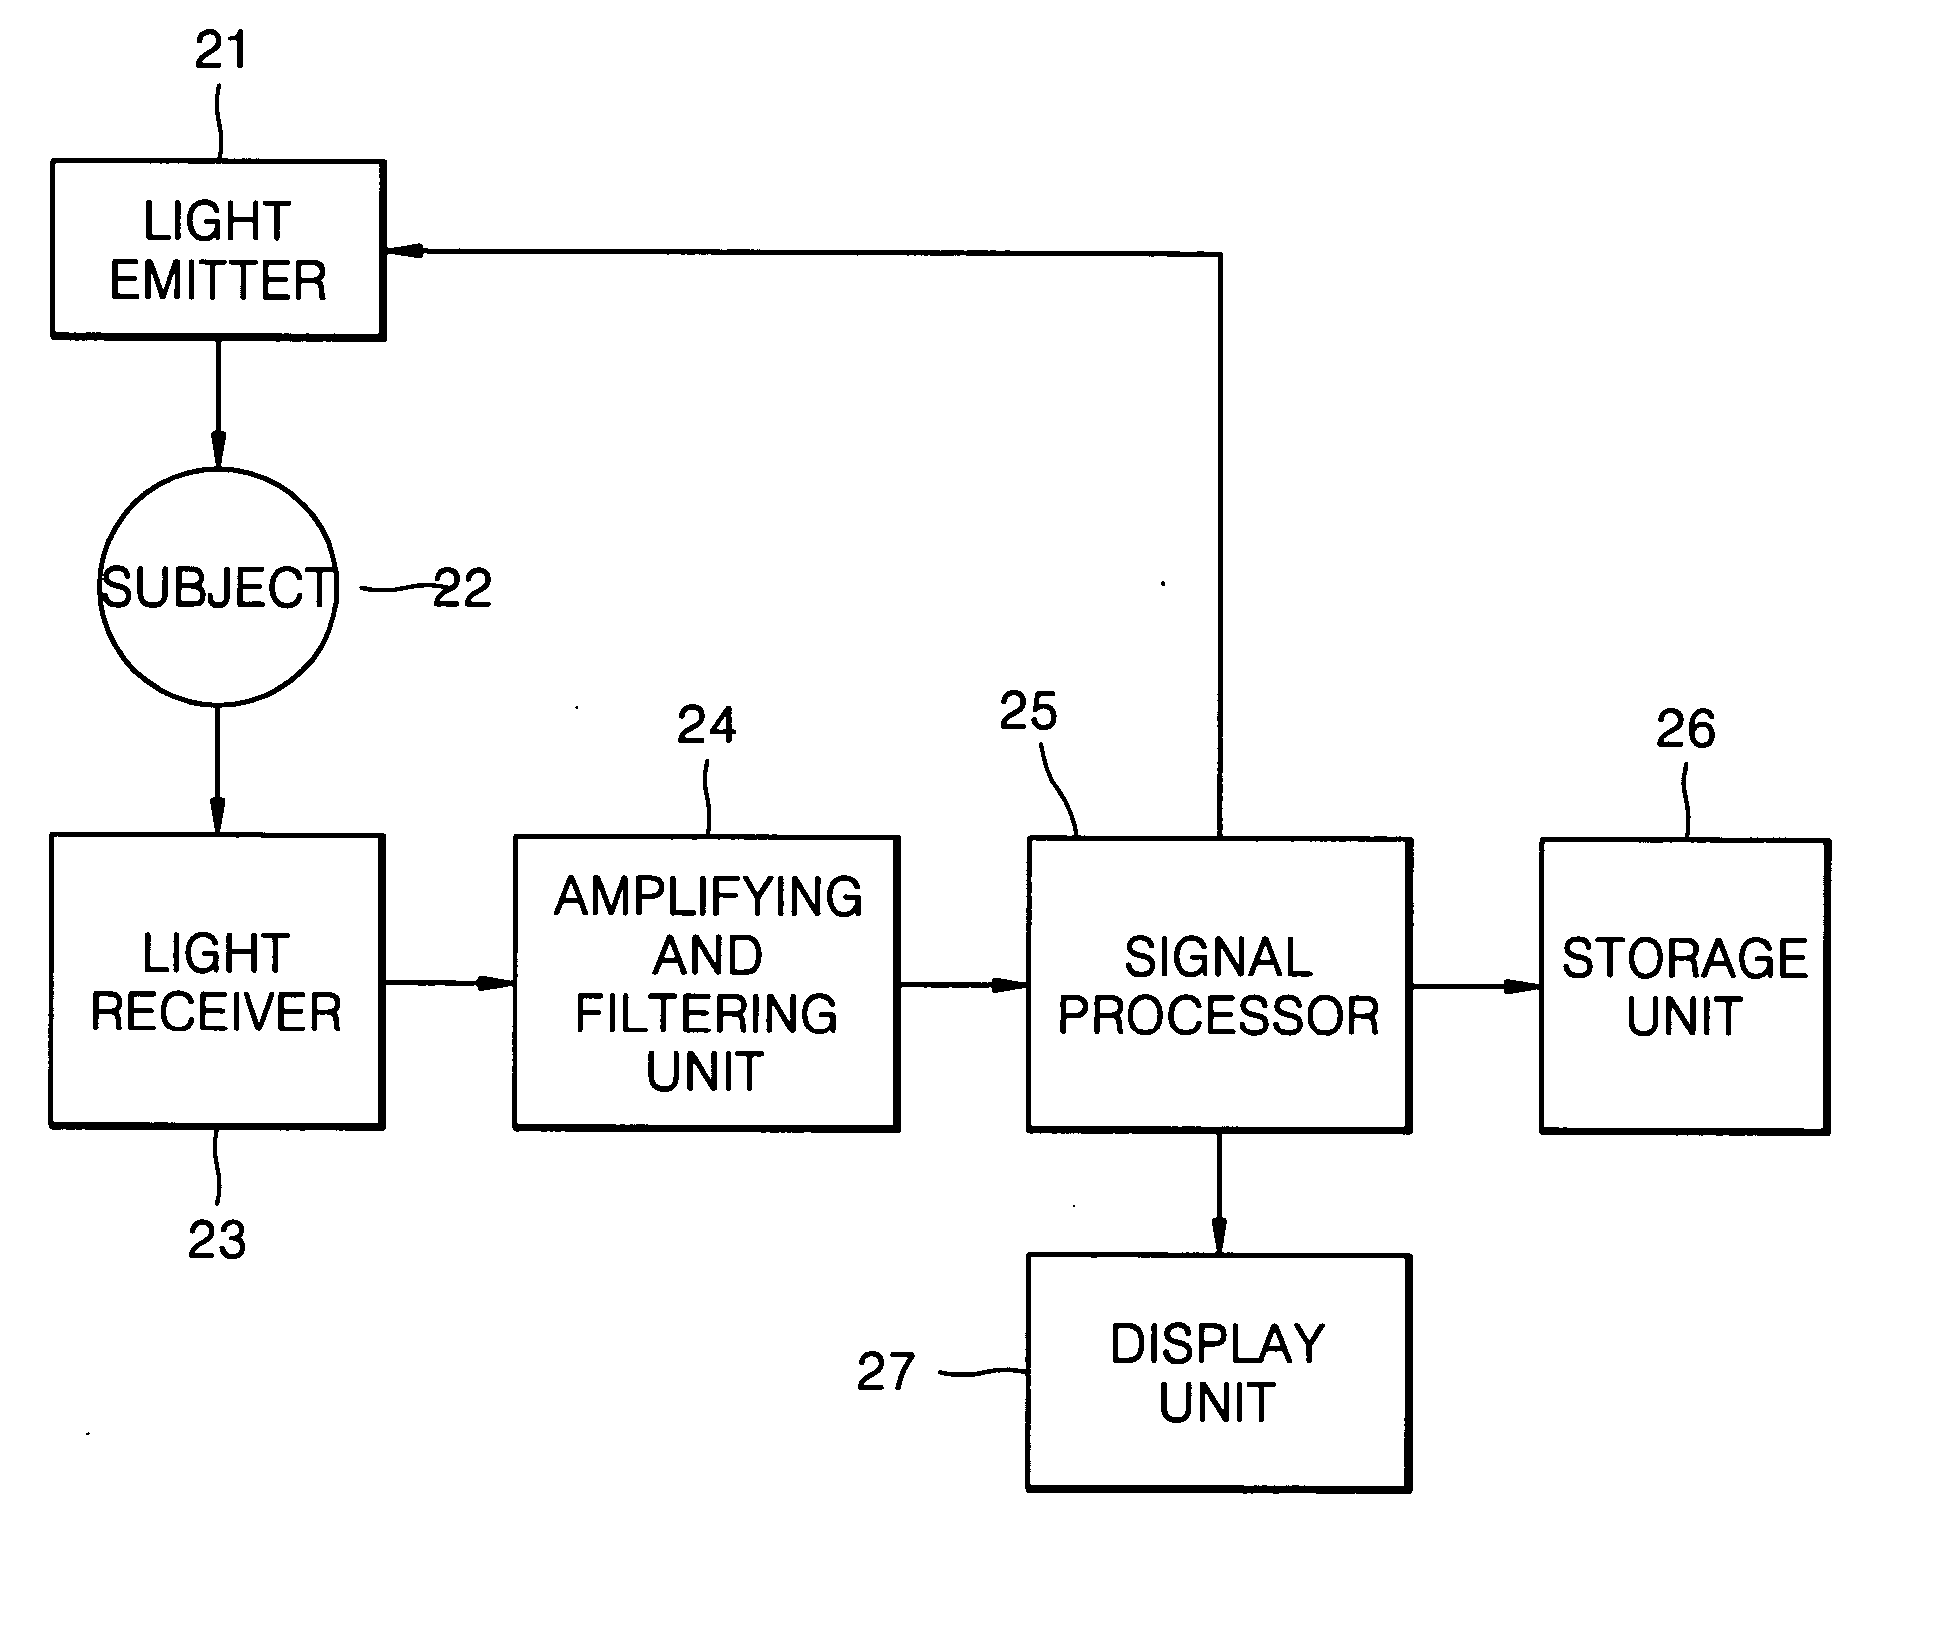
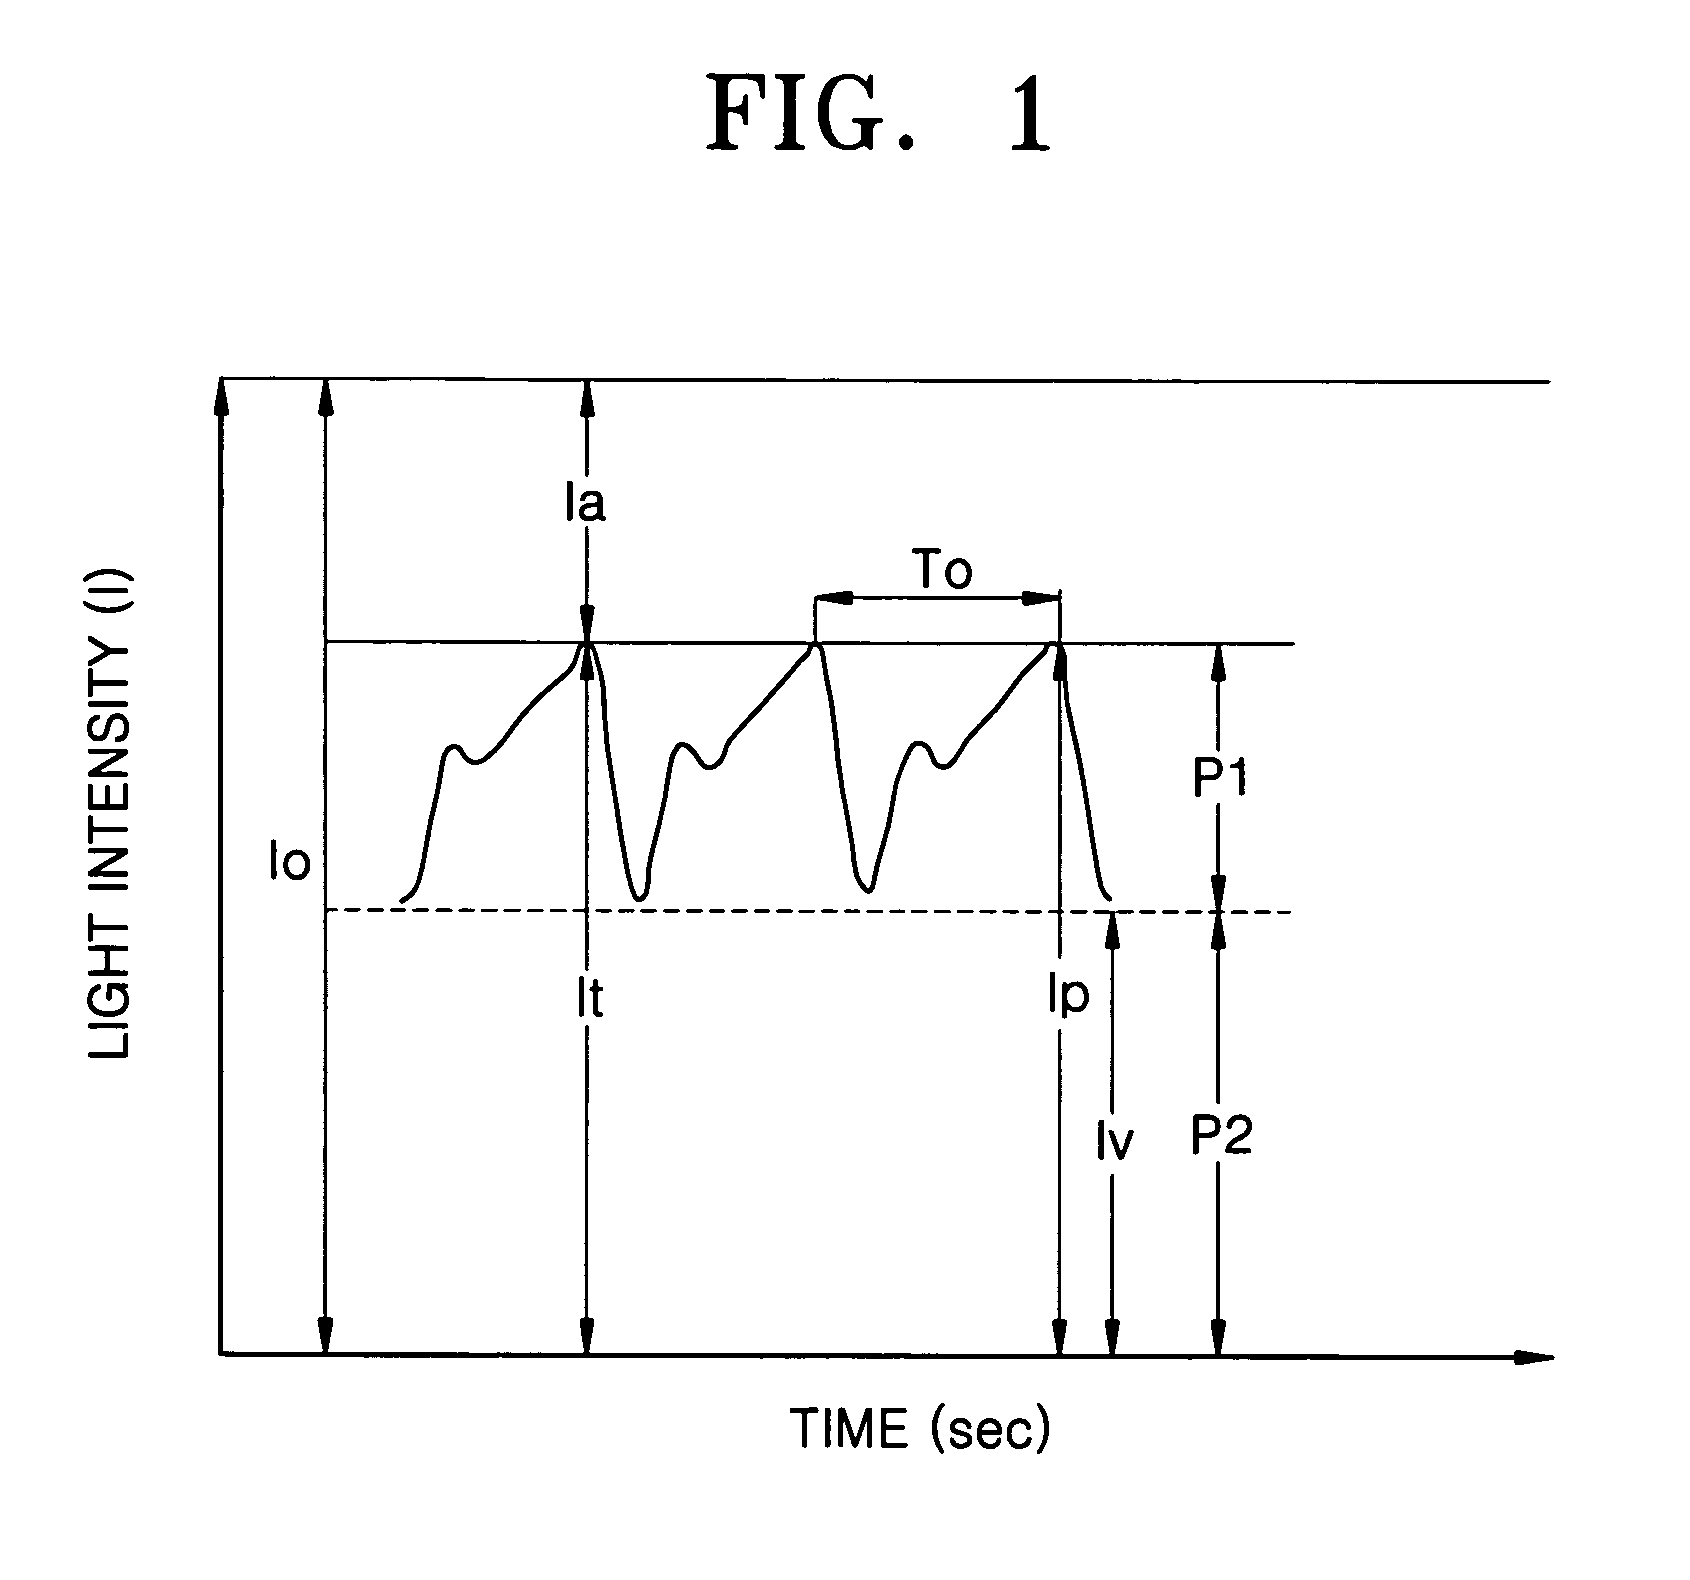
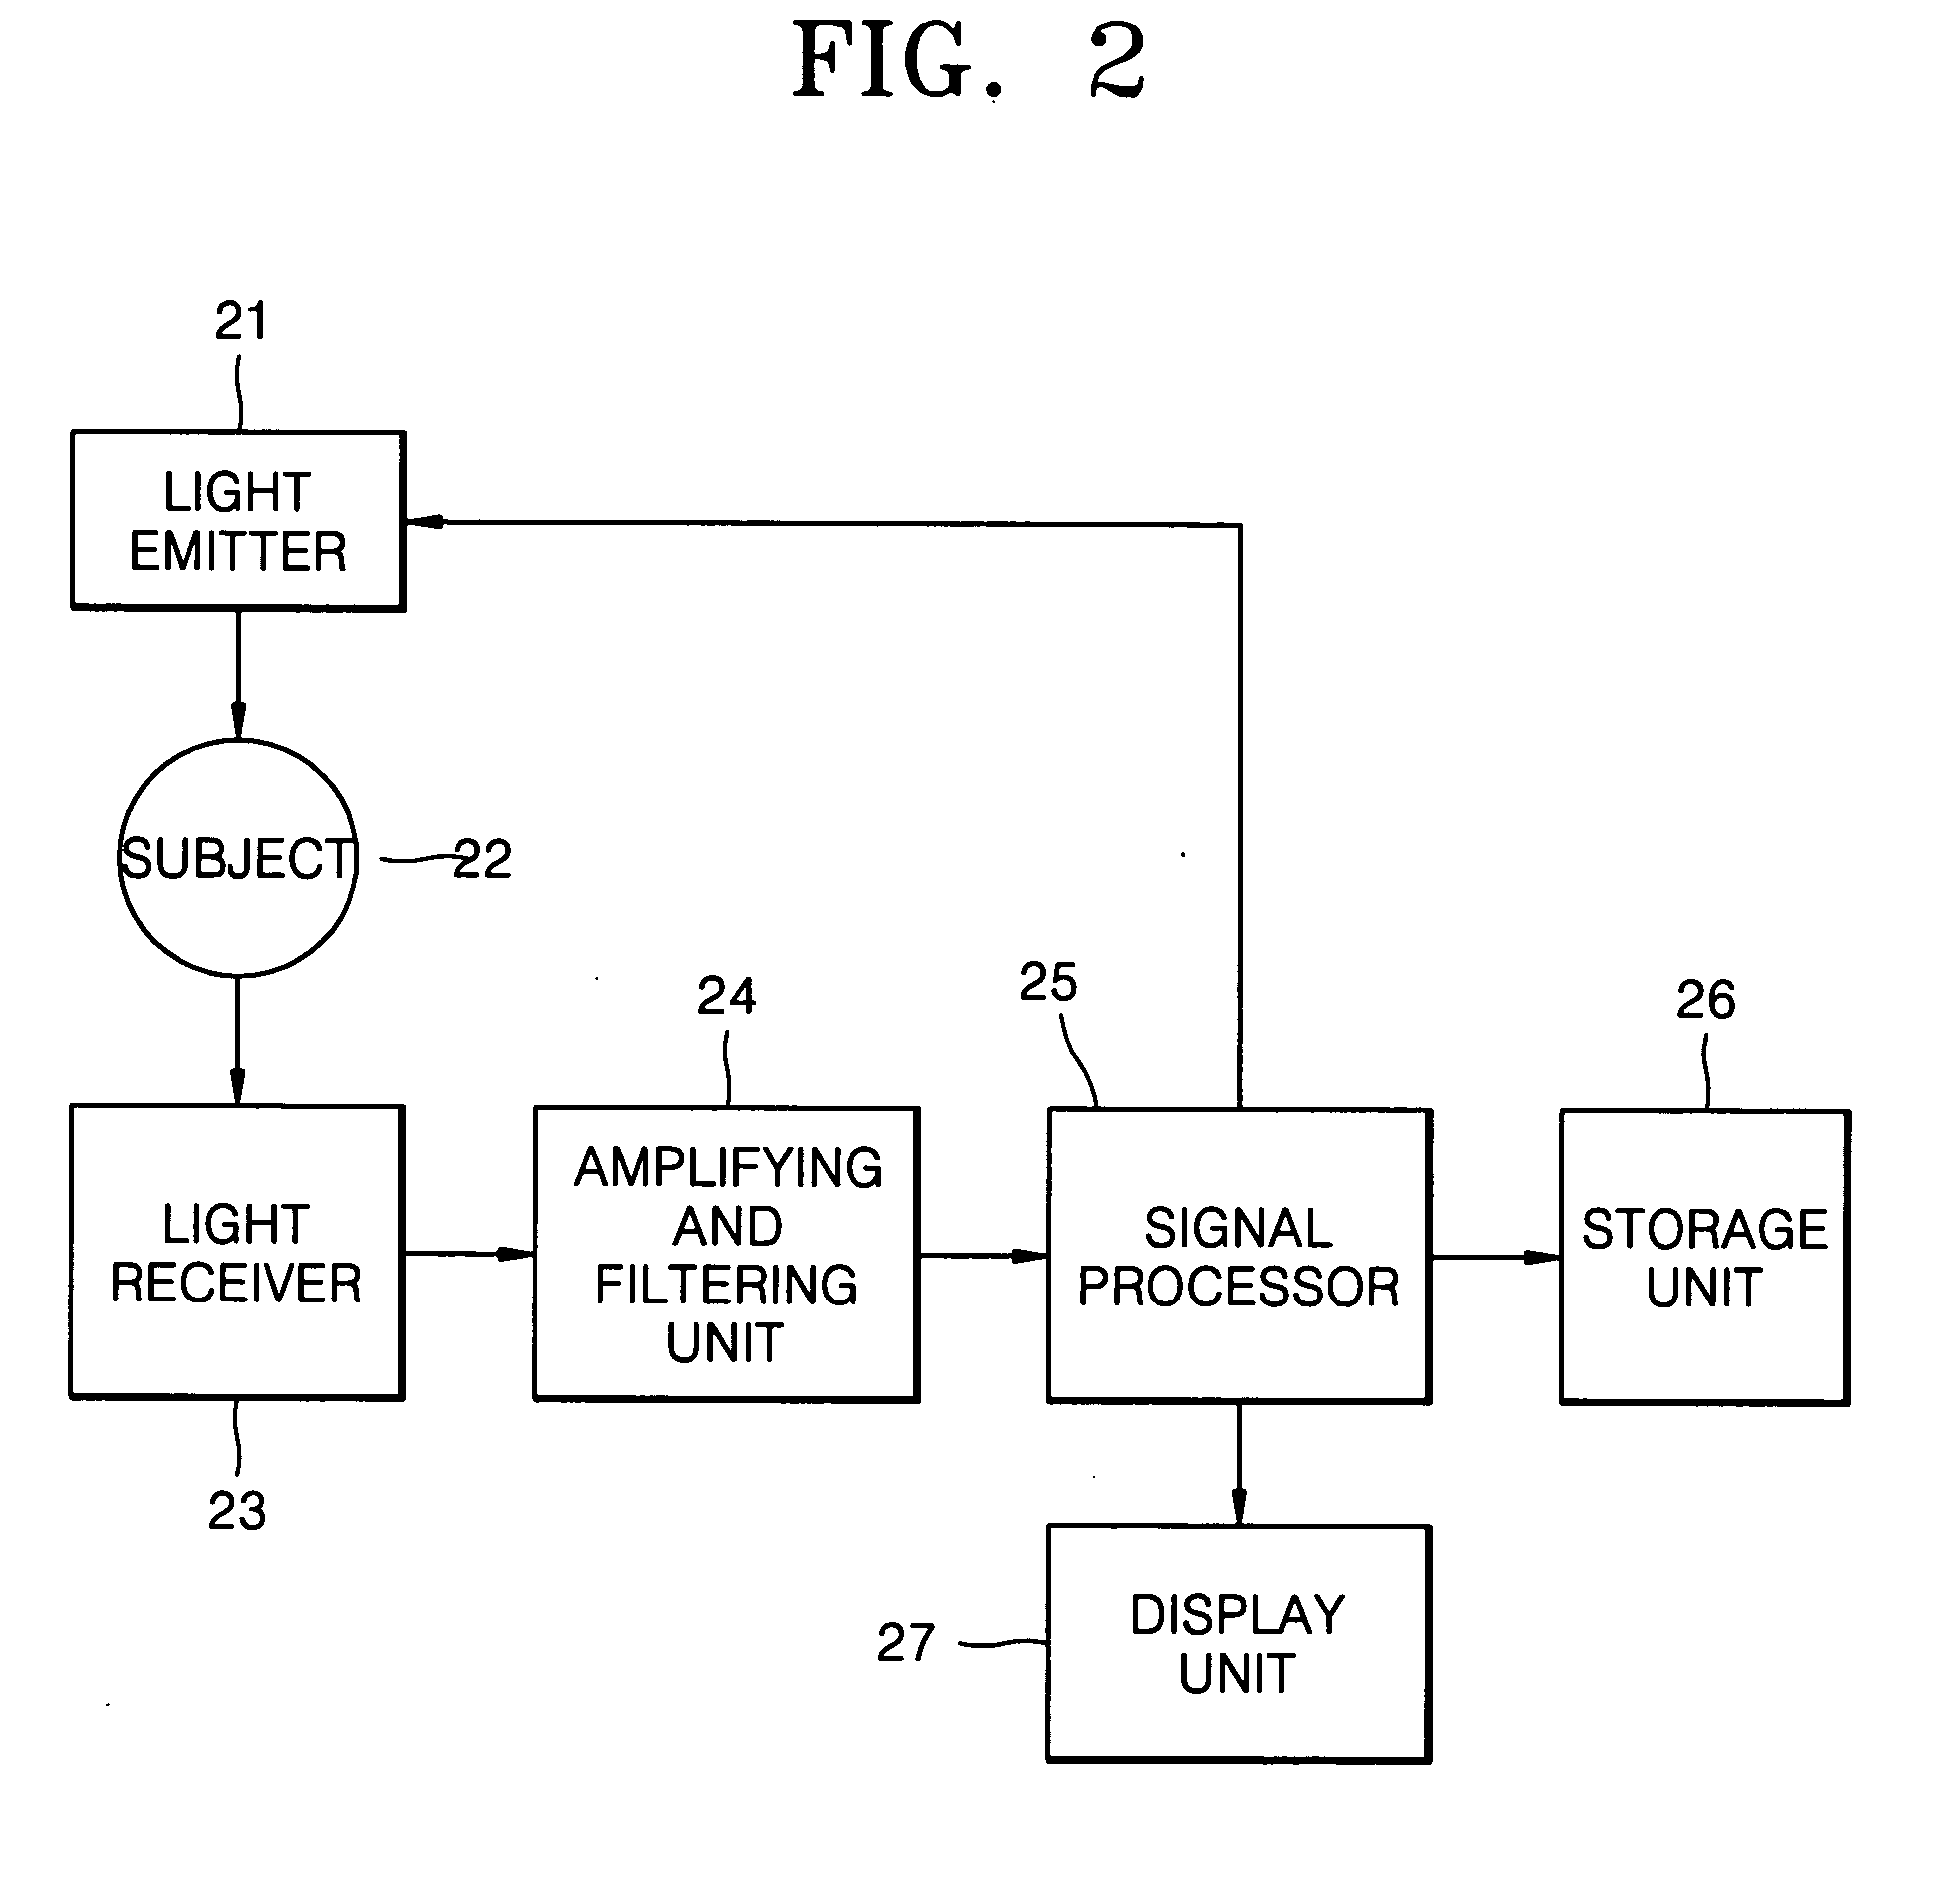

Image

  • Method of removing abnormal data and blood component spectroscopy analysis system employing the same
  • Method of removing abnormal data and blood component spectroscopy analysis system employing the same
  • Method of removing abnormal data and blood component spectroscopy analysis system employing the same

Examples


Embodiment Construction

[0046] In order to obtain quantitative results of a method of removing abnormal data according to an embodiment of the present invention, data was continuously collected for ten (10) minutes from thirty (30) subjects lying on their back and having a hemoglobin concentration of 10.5-16.5 g / dl. The population composed of thirty (30) subjects was divided at a ratio of 2 to 1, and a regressive equation was obtained through multivariate linear regressive analysis having twenty (20) subjects as a calibration model. The regressive equation was applied to the data collected from the remaining ten (10) subjects to calculate the result for a prediction model. Hemoglobin values of all the subjects to be used as references were measured using HemoCue AB (Sweden), an apparatus for invasively measuring hemoglobin using a cuvette.

[0047] In order to determine whether parameters, i.e., RORs between wavelengths, were abnormal data, a standard deviation for a ratio R.sub.13 of a logarithmic ratio with...


PUM

PropertyMeasurementUnit
wavelengthaaaaaaaaaa

Abstract

A method of removing abnormal data in a blood component analysis system using spectroscopy to estimate a concentration of a blood component by analyzing a photo-plethysmographic (PPG) signal obtained by radiating light of first and second wavelengths reacting to the blood component on a subject and detecting light corresponding to the first and second wavelengths output from the subject, includes collecting the PPG signal corresponding to the first and second wavelengths for a predetermined unit period of time, calculating "n" parameters, with respect to "n" pulse data included in the collected PPG signal, where n is a positive integer, calculating an average of the "n" parameters, and comparing a ratio of a number of parameters whose deviation from the average is greater than a predetermined standard deviation to the "n" parameters with a predetermined removal reference value to determine whether the "n" pulse data is valid.

Description

[0001] 1. Field of the Invention[0002] The present invention relates to a blood component analysis system. More particularly, the present invention relates to a method of removing abnormal data generated due to internal and external factors, and to a blood component spectroscopy analysis system employing the same.[0003] 2. Description of the Related Art[0004] The measurement of a vital signal using a non-invasive method is an important issue in the field of current medical engineering, and methods of measuring various physiological variables have been developed. In particular, various approaches for analyzing blood components without collecting blood have been published, and studies on analysis of blood components without collecting blood have been undertaken. For example, in a method of analyzing blood components using spectroscopy, without collecting blood, a patient does not suffer pain and is not exposed to potential infection, and the result of analysis can be obtained in real ...

Claims


Application Information

Patent Timeline
Patent Type & Authority Applications(United States)
IPC IPC(8): A61B5/0245A61B5/00A61B5/145A61B5/1455G01N21/17
CPCA61B5/14532A61B5/1455Y10T436/106664Y10T436/105831Y10T436/102499G01N21/17
Inventor LEE, JONG-YOUNYOON, GIL-WON
Owner SAMSUNG ELECTRONICS CO LTD
Why Eureka
Try Eureka