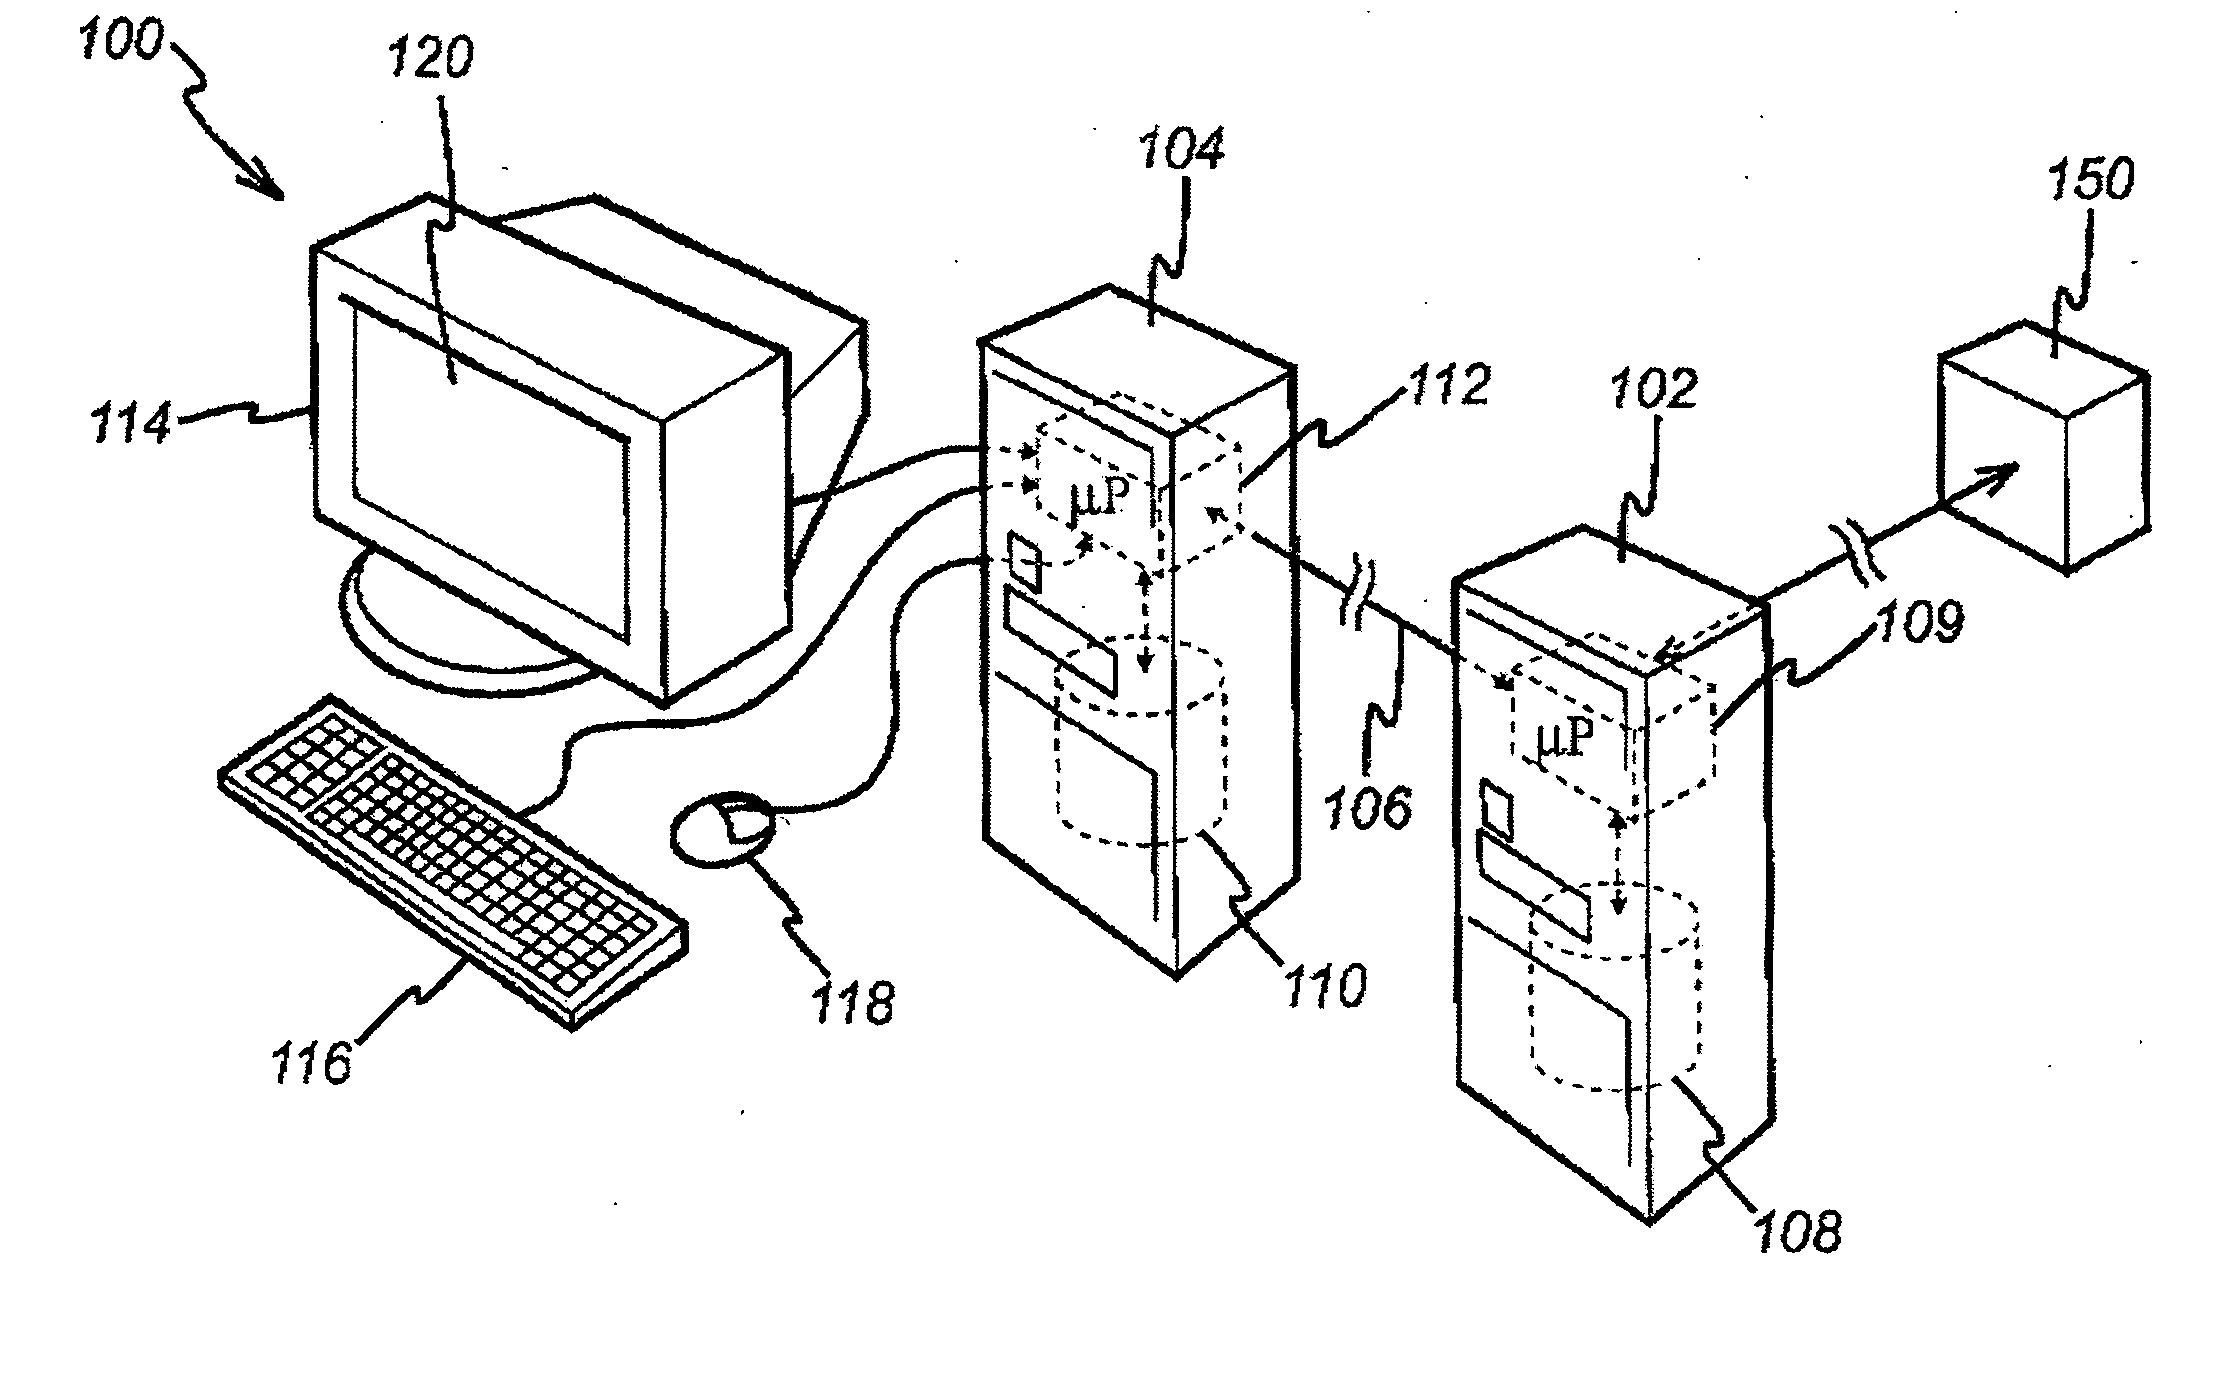
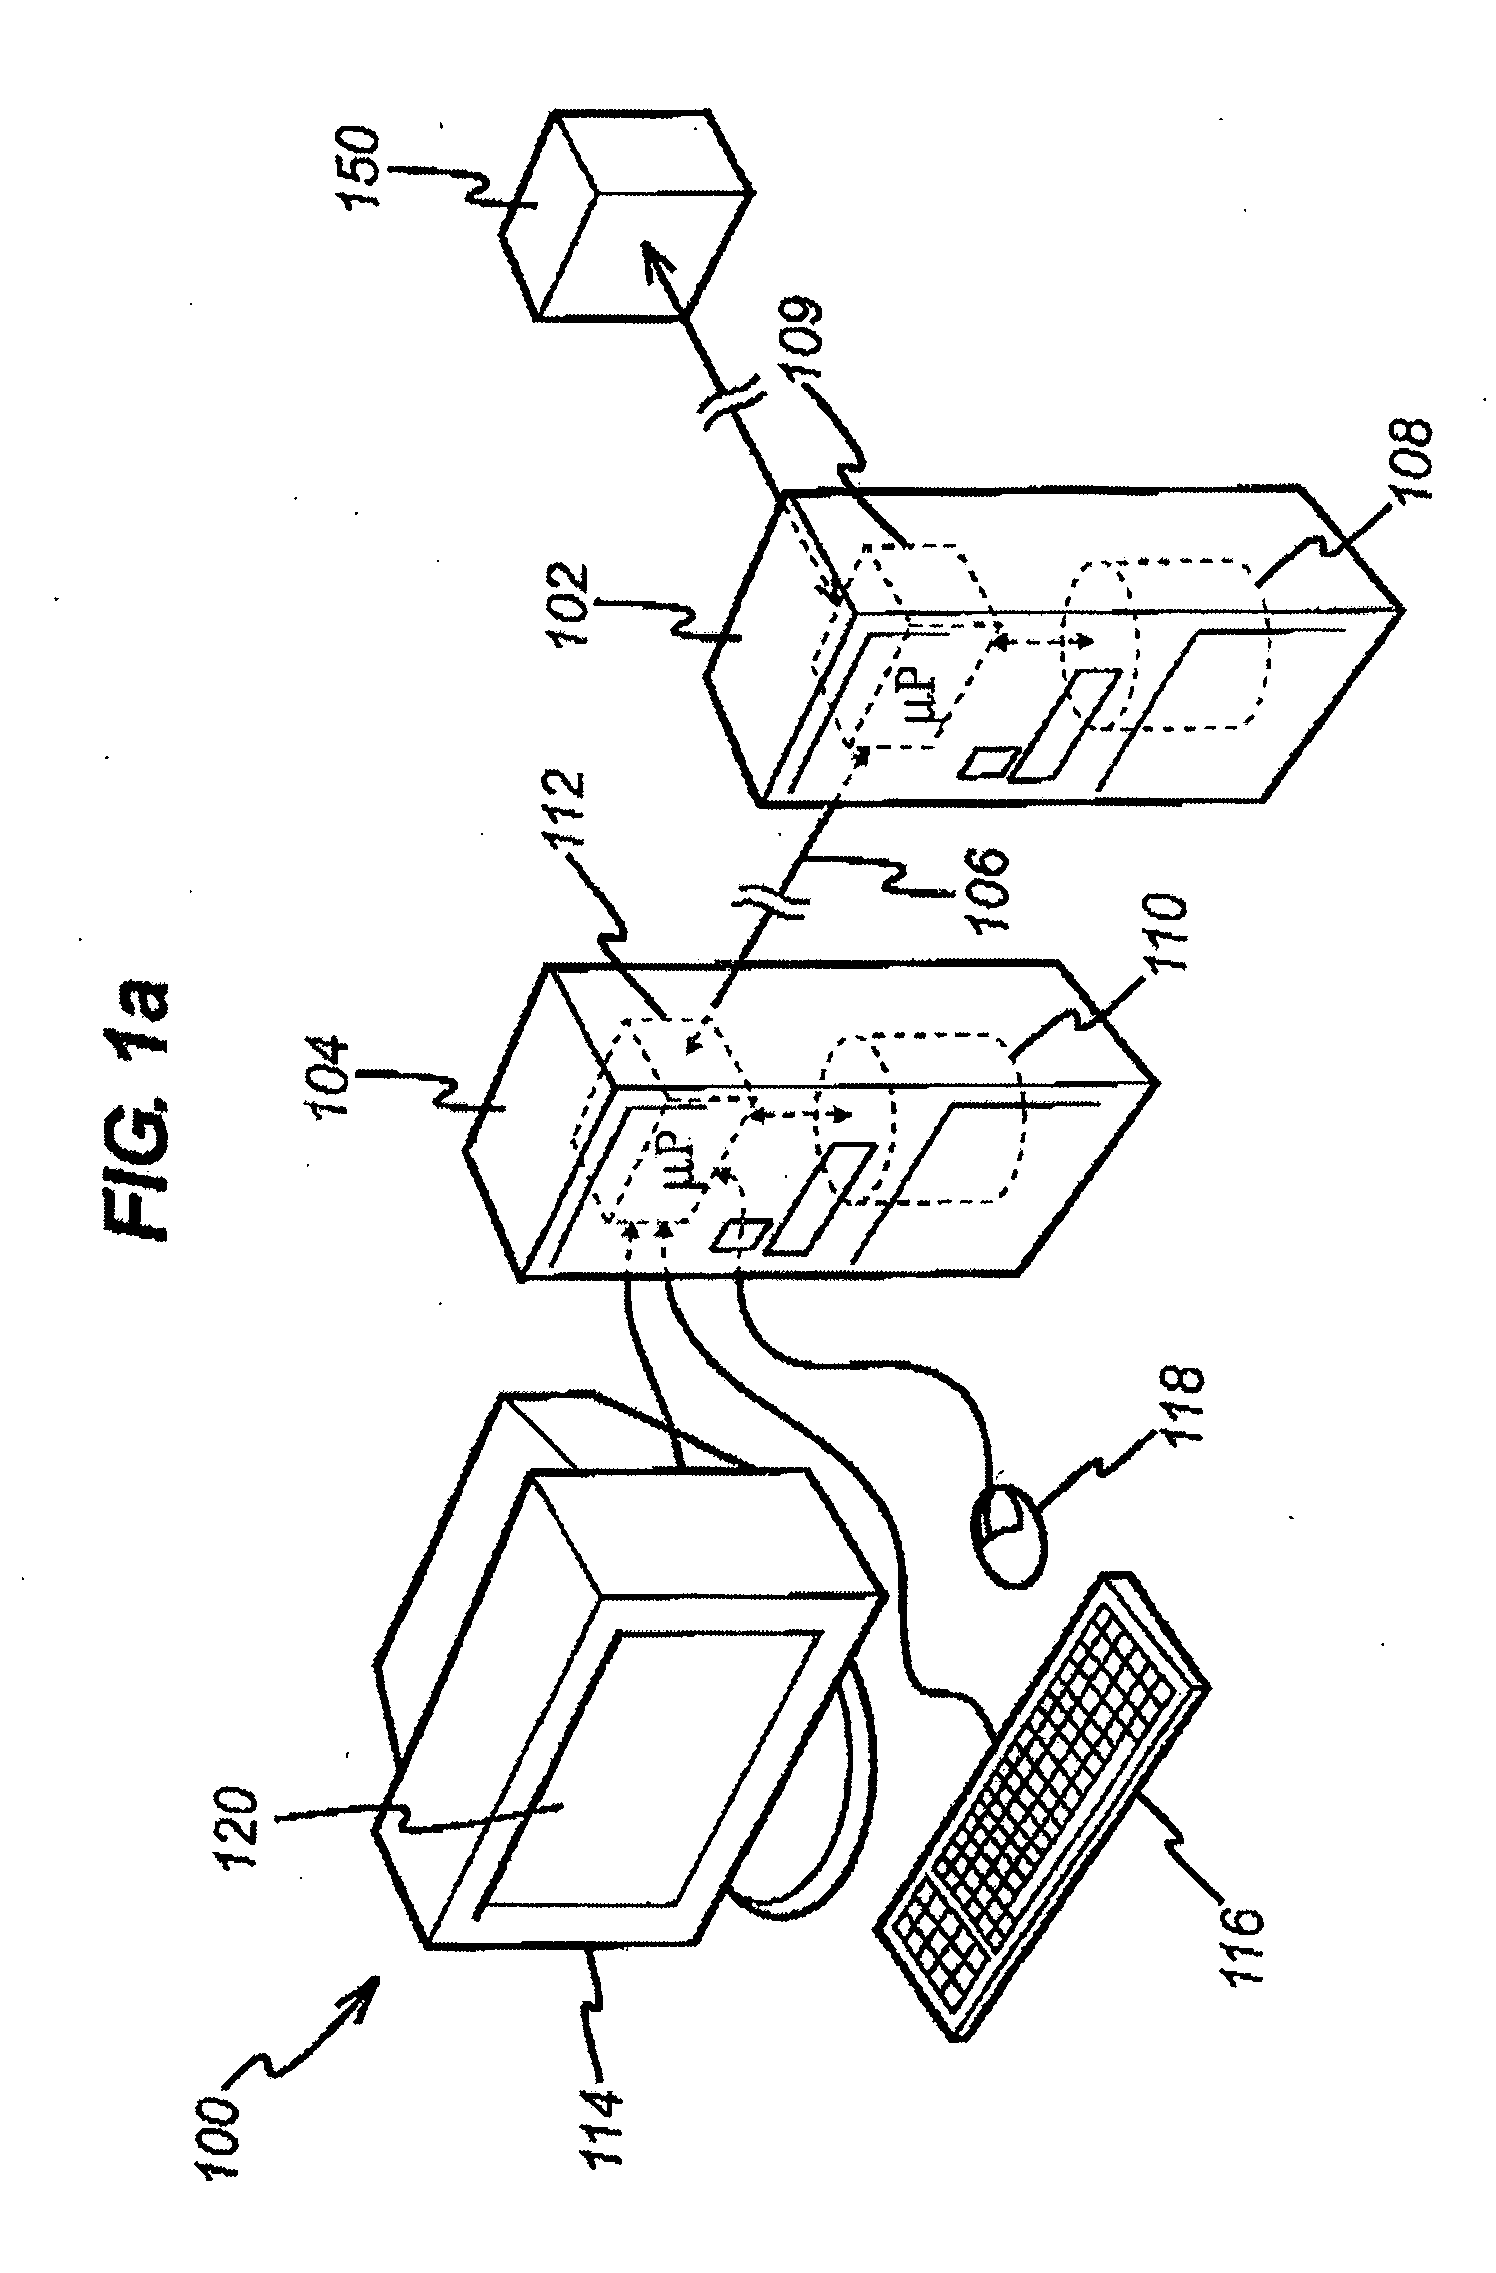
[0018] In particular, in an aspect of the present invention, there is provided a
processing unit; a display screen connected to the
processing unit; and manipulation means connected to the
processing unit, wherein the processing unit is configured to generate a
user interface on the display screen including a visual representation of financial data, wherein a plurality of first icons are arranged in the visual representation, each first icon representing a category of financial data and operable to be activated by the manipulation means, the arrangement of each first icon in the visual representation corresponding to first financial data associated with the category represented by each first icon, wherein on activation of an icon the processing unit is configured to modify the visual representation such that second financial data corresponding to the category of the activated icon other than the first financial data represented in the arrangement of the first icons is displayed in the visual representation. The category of financial data may be representative of a particular tradable asset or a group of tradable assets, categorized according to their
industry sector or geographical origin. For example, the present invention enables multivariate financial data to be displayed in an easily interpretable way for single assets or groups of assets. In particular, more than two variables can be accessed and displayed for each particular category.
[0019] In one embodiment of the present invention, the second financial data is displayed in a data component corresponding to the activated icon. The data component may be an
alphanumeric representation of the second data, for example a table containing the second financial data. This way, first financial data for a particular category can be easily interpreted in the visual representation and additional second financial data can be accessed through the
user interface.
[0020] In another embodiment of the present invention, the second financial data is represented by a plurality of second icons plotted in the visual representation on activation of a first icon, each second icon corresponding to a sub-category of financial data in the category corresponding to the activated first icon. This way, all the multivariate financial data for a particular category can be viewed in the visual representation according to its arrangement and thus easily interpreted. Advantageously, only the second icons may be displayed in the visual representation on activation of an icon.
[0025] An embodiment of the present invention, a plurality of first icons represents a single category of financial data, each first icon representing the financial data corresponding to the single category at a
specific time. The plurality of first icons representing a single category of financial data can be linked by a line in time order. Additionally, a plurality of second icons represents a single sub-category of financial data, each second icon representing the financial data corresponding to the single sub-category at a
specific time. The plurality of second icons representing a single category of financial data can be joined in time order. Thus, the history of a particular category of first and / or second financial data can be viewed and easily interpreted.
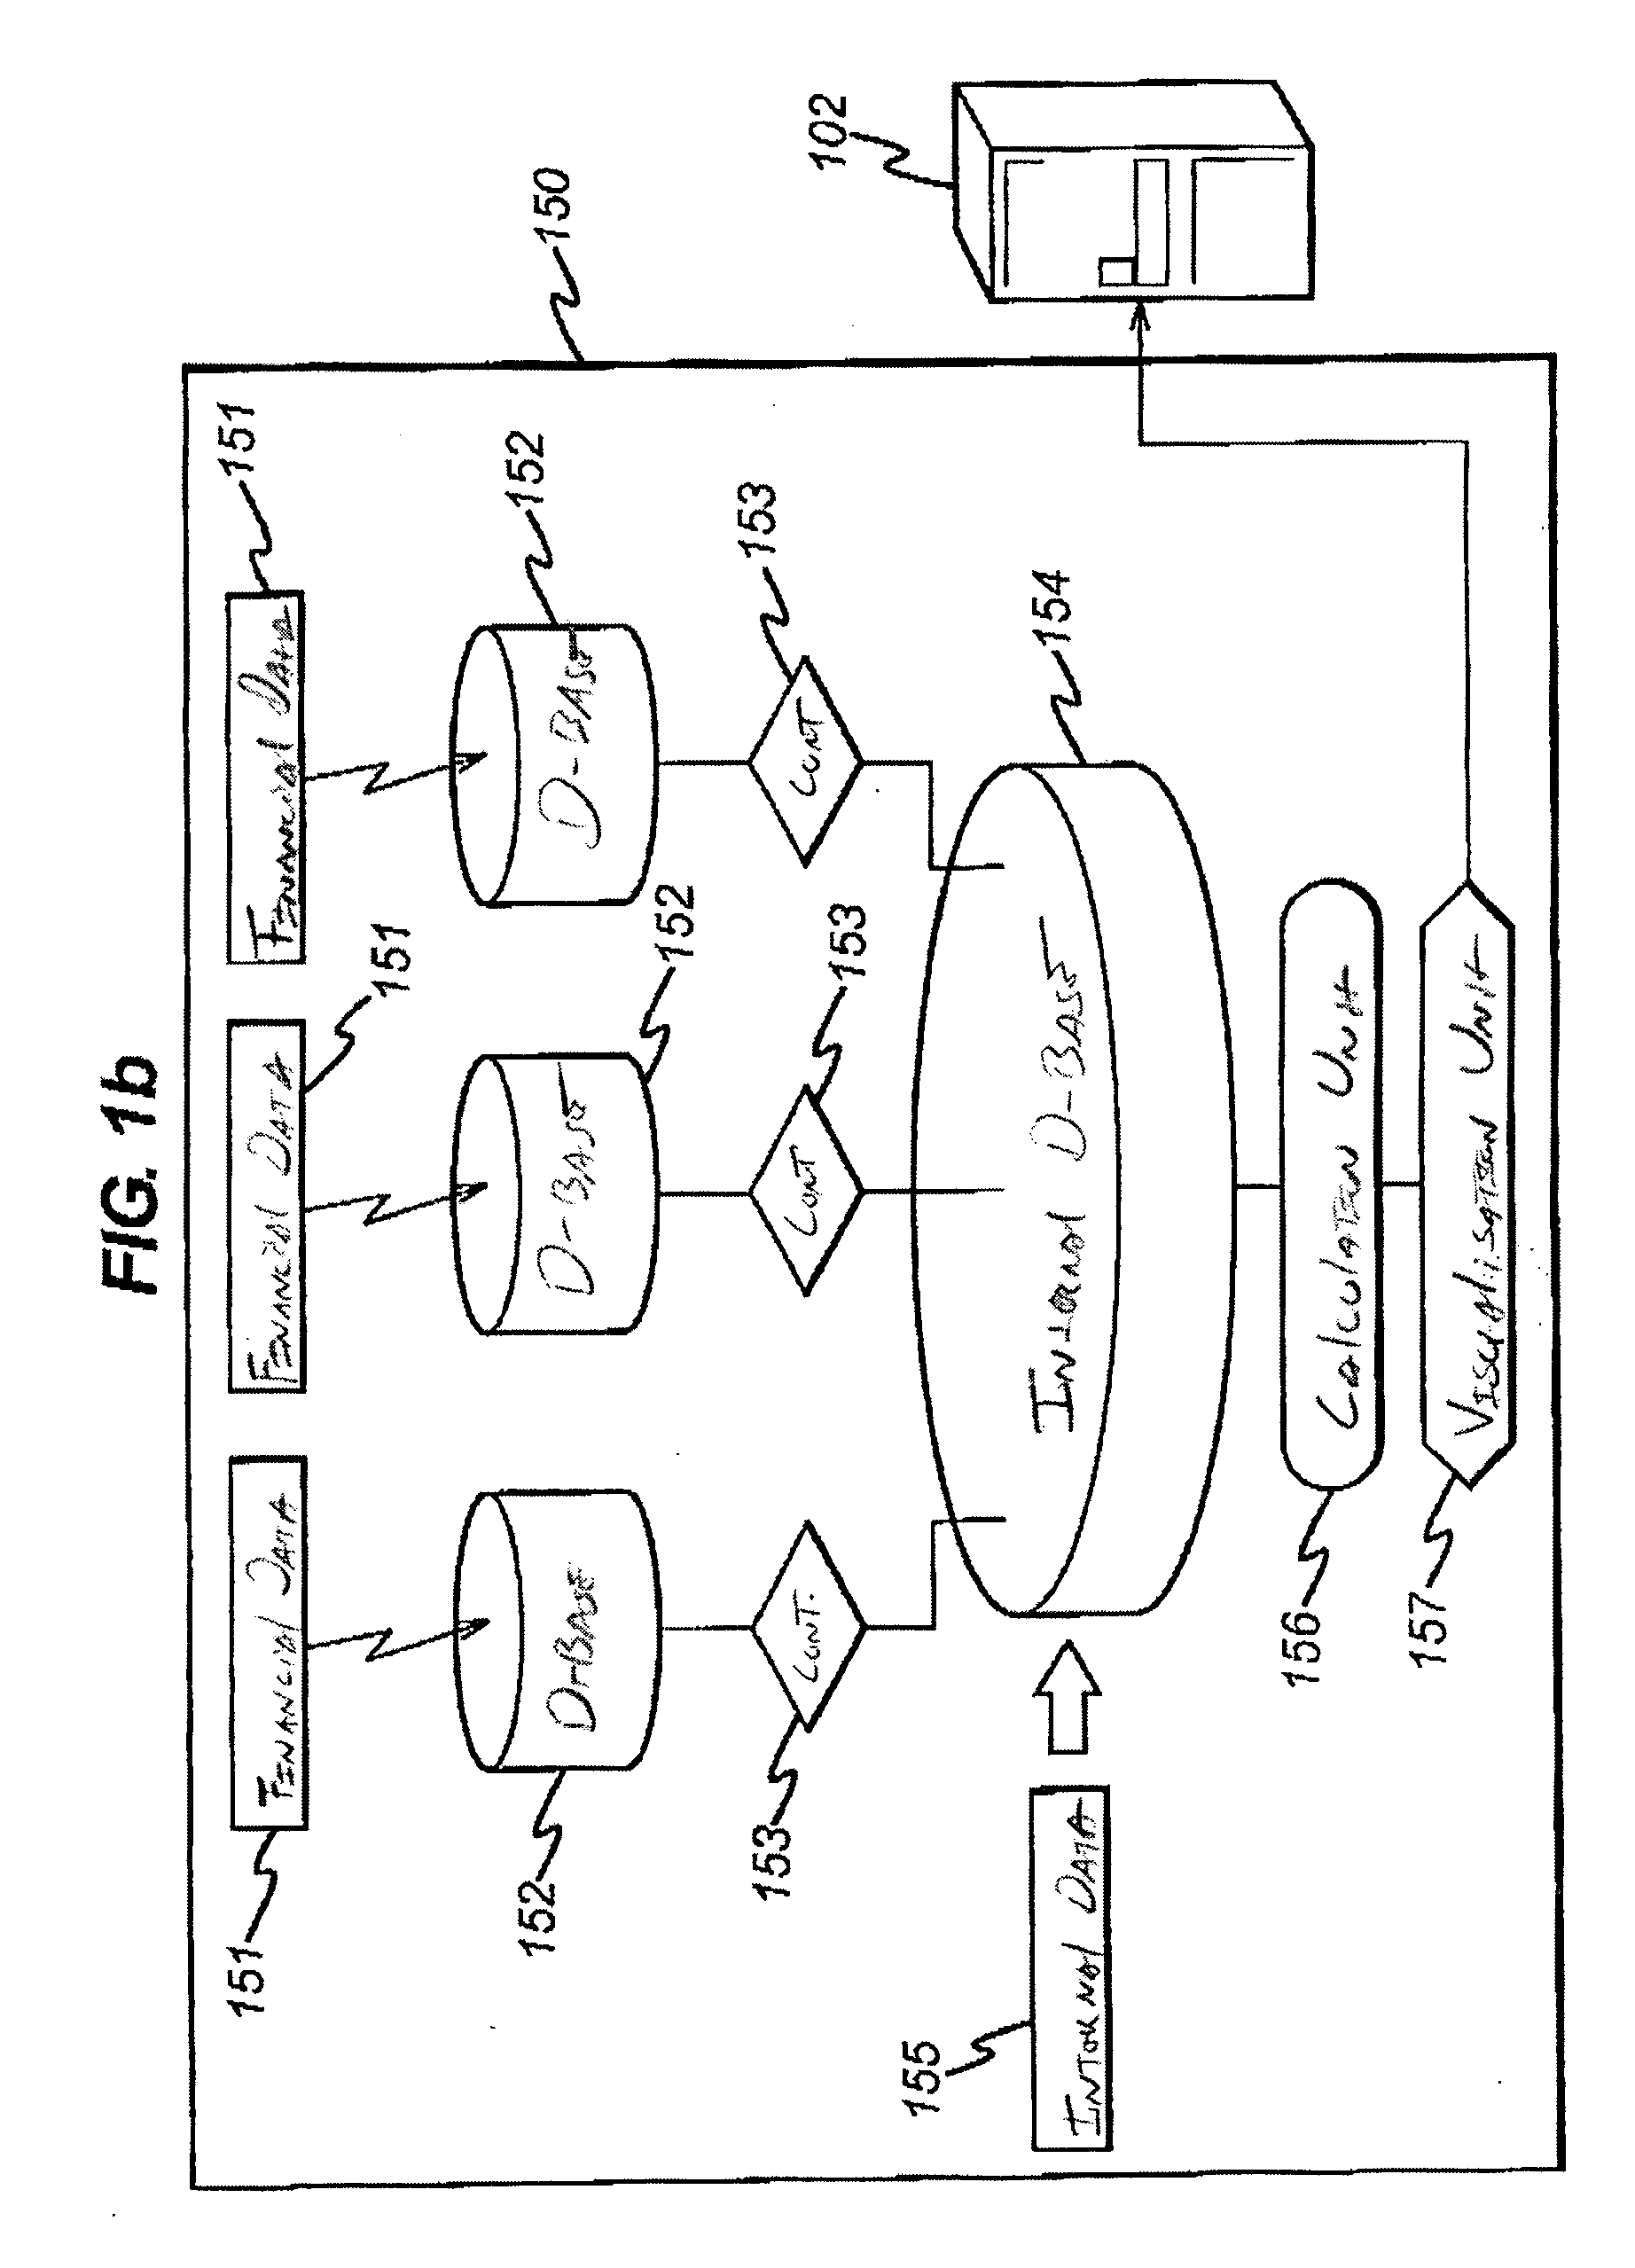
[0036] Another aspect of the present invention is to allow a user to interrogate external financial data quickly and efficiently and to
drill up or
drill down and across multiple graphical displays (“maps”) of information, i.e. from the top down (e.g.,
macro / asset level,
geographic regions / markets, sectors) and / or from the bottom up (e.g.,
stock level) and to filter the data against indicators (e.g., RSI, EMOM, and MACD). The maps offer multiple dimensional
filtration functionality enabling a comparison between different investment strategies (e.g., growth versus value approach). Each filter or group of filters of requested indicators applied by the user can cause a recalculation the data for any given map or sub-map of information. Users can visualize the market rotation prevailing in their areas of investment interest and quickly identify market anomalies, (for example, inflection / turning points, outliers, and catalysts of change).
[0042] Furthermore, to generate the map of one type of data verse another, the individual icons can be color, shape, and / or size coded with additional data, for example the range of MACD between −3 and 3 can represent a range of colors, to add to the data displayed on the
user interface. The icon adds another dimension to the map without adding an additional axis of data. An embodiment allows three or more different combinations of external and internal financial data and indicators to be plotted on a two-dimensional map.

