Biomarkers for sepsis
a sepsis biomarker and sepsis technology, applied in the field of diagnosis, can solve the problems of increasing the difficulty in devising a diagnostic test, consuming a lot of time, and consuming the culturing of some microorganisms,
- Summary
- Abstract
- Description
- Claims
- Application Information
AI Technical Summary
Benefits of technology
Problems solved by technology
Method used
Image
Examples
example 1
Materials and Methods for the Experimental Results Described in Example 2
Microarray Manufacture
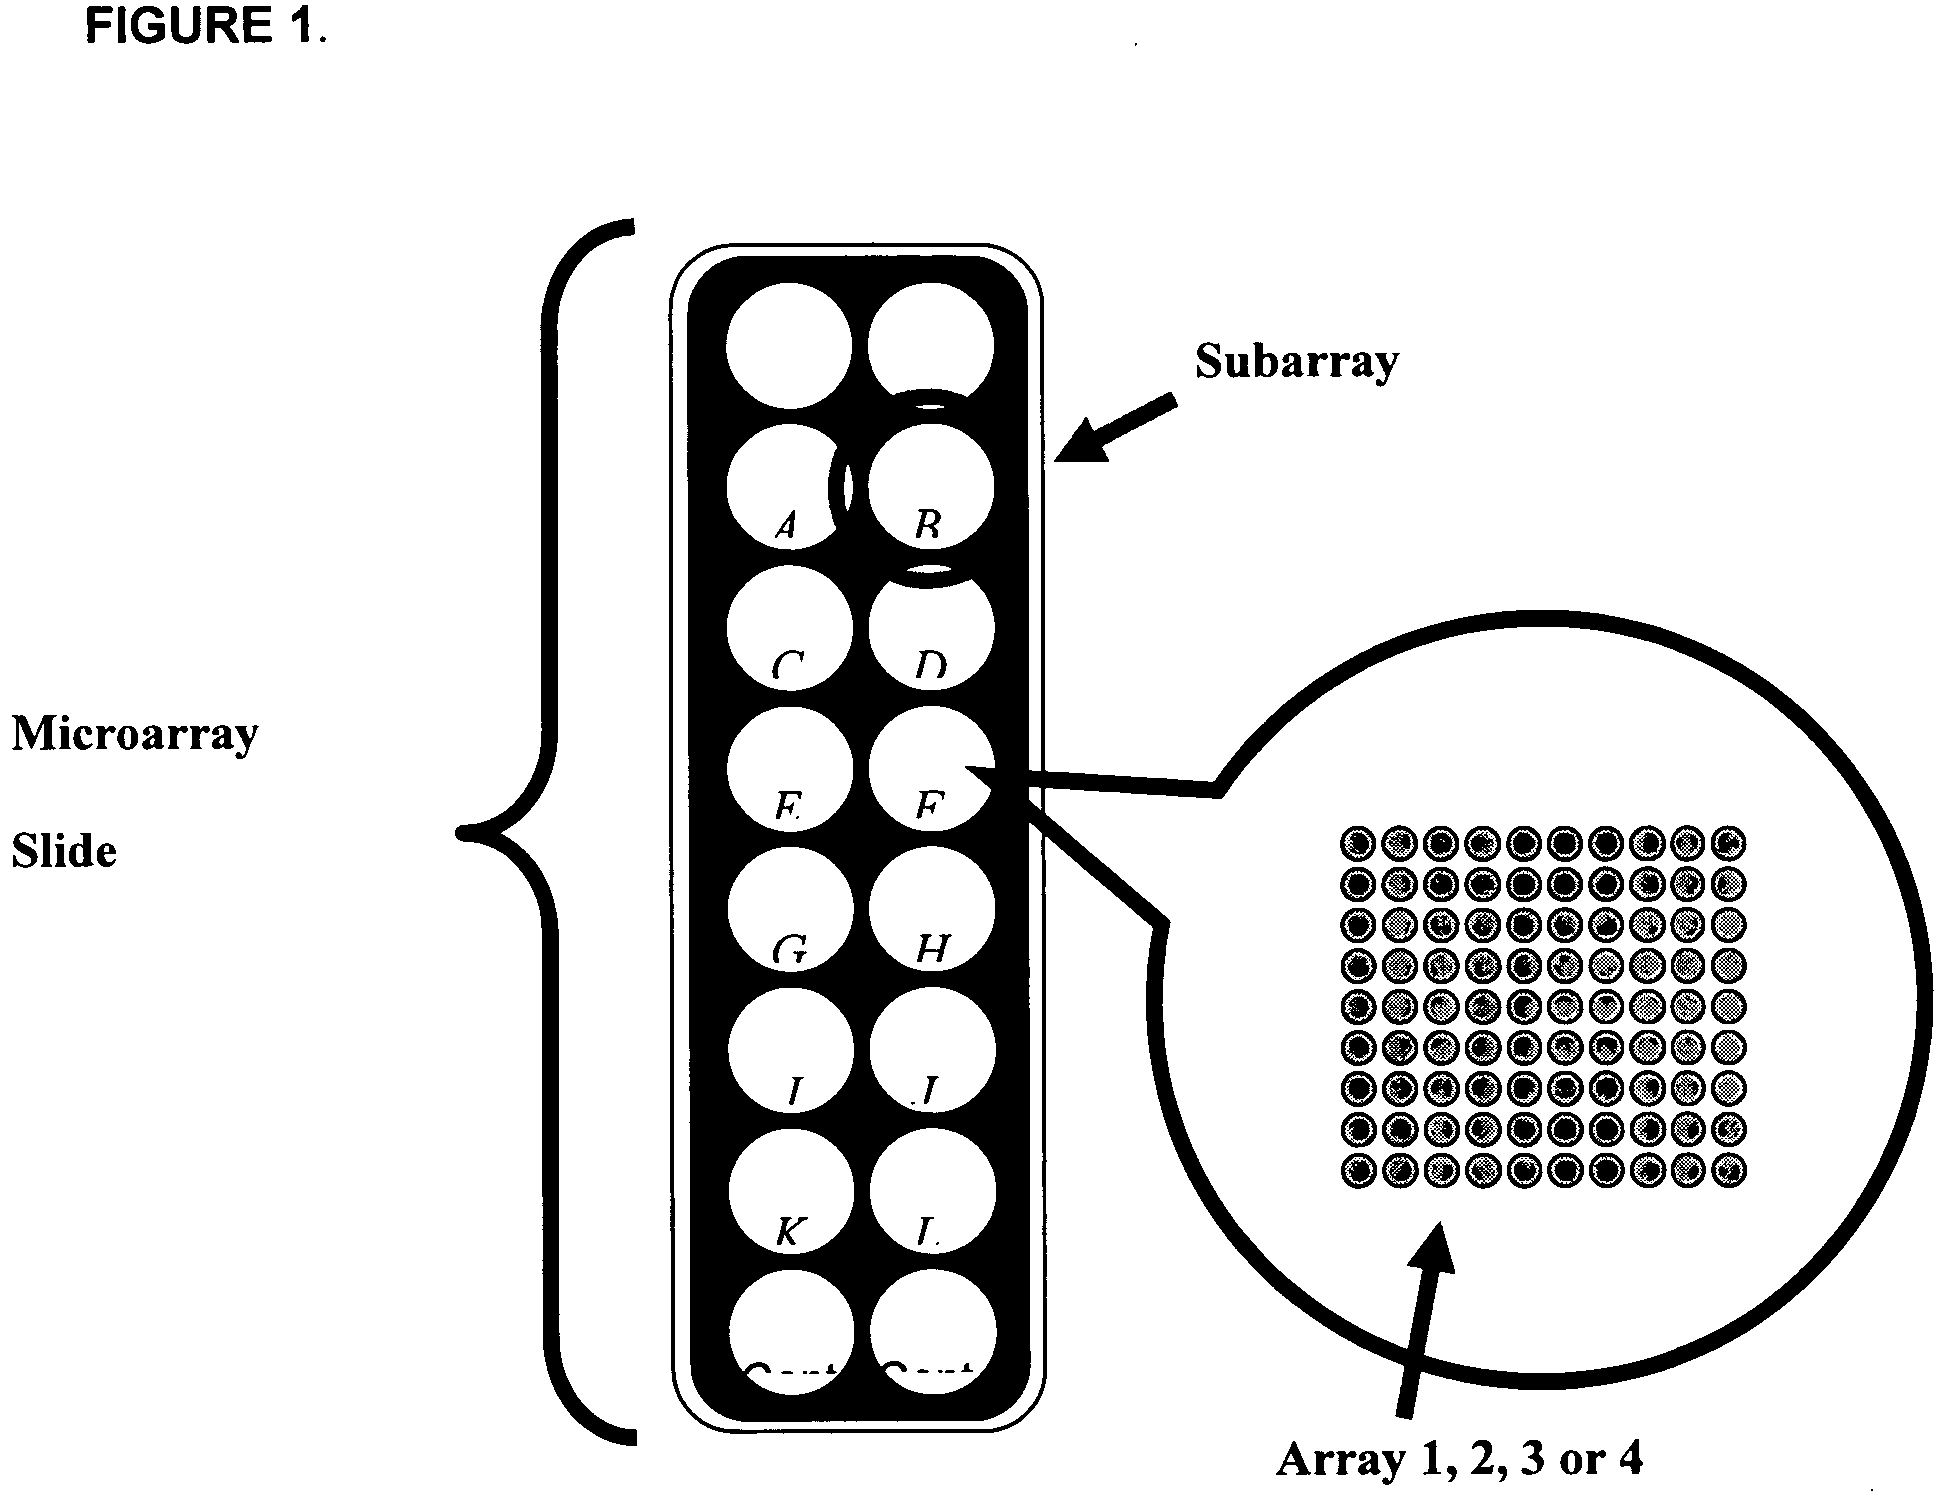
[0066] Glass slides were cleaned and derivatized with 3-cyanopropyltriethoxysilane. The slides were equipped with a Teflon mask, which divided the slide into sixteen 0.65 cm diameter wells or circular analysis sites called subarrays (FIG. 11). Printing was accomplished with a Perkin-Elmer SpotArray Enterprise non-contact arrayer equipped with piezoelectric tips, which dispense a droplet (˜350 pL) for each microarray spot. Antibodies were applied at a concentration of 0.5 mg / mL at defined positions.
[0067] Each chip was printed with sixteen copies of one type of array, either Array 1.1.1, 2.1.1, 3.1.1, or 4.1. A set of cytokines was printed with quadruplicate spots in each subarray. After printing, chips were inspected using light microscopy. If the percentage of missing spots observed was greater than 5%, then the batch failed and the slides were discarded immediately. For all print run...
example 2
Candidate Biomarkers for Sepsis
[0073] Analyte levels from sepsis patients were compared with normal individuals to identify candidate biomarkers for sepsis. Candidate biomarkers for sepsis were posited to be manifest as a difference in blood analyte levels between time zero sepsis patients and normal controls and that trended toward the normal control value at day 7 in the surviving sepsis patients, in whom sepsis was presumably resolving. For ease of comparison, data were plotted 4 different ways for both serum and citrate plasma samples.
[0074] Of 107 analytes analyzed, six (6%) exhibited interesting differences between the sepsis patients at time zero and normal controls, and that decreased over time, including IL-8, IL-6, IL2sRα, MMP-7, MIPF-1 and IGFBP-1. A brief description for each of the analyte is provided below.
[0075] Since the value of correlation coefficient is very sensitive to outliers and multimode distributions of data, our interpretation is very conservative.
[007...
example 3
Materials and Methods for Results Described in Example 4
Microarray Manufacture
[0090] Glass slides were cleaned and derivatized with 3-cyanopropyltriethoxysilane. The slides were equipped with a Teflon mask, which divided the slide into sixteen 0.65 cm diameter wells or circular analysis sites called subarrays (FIG. 14). Printing was accomplished with a Perkin-Elmer SpotArray Enterprise non-contact arrayer equipped with piezoelectric tips, which dispense a droplet (˜350 pL) for each microarray spot. Antibodies were applied at a concentration of 0.5 mg / mL at defined positions.
[0091] Each chip was printed with sixteen copies of one type of array, i.e. Array 5. A set of cytokines was printed with quadruplicate spots in each subarray. After printing, chips were inspected using light microscopy. If the percentage of missing spots observed was greater than 5%, then the batch failed and the slides were discarded immediately. For all print runs described herein, 100% of the antibody feat...
PUM
 Abstract
Description
Claims
Application Information
 - R&D
- Intellectual Property
- Life Sciences
- Materials
- Tech Scout
- Unparalleled Data Quality
- Higher Quality Content
- 60% Fewer Hallucinations
Browse by: Latest US Patents, China's latest patents, Technical Efficacy Thesaurus, Application Domain, Technology Topic, Popular Technical Reports.
© 2025 PatSnap. All rights reserved.Legal|Privacy policy|Modern Slavery Act Transparency Statement|Sitemap|About US| Contact US: help@patsnap.com


