Method and a system for determination of particles in a liquid sample
a liquid sample and particle technology, applied in the field of methods and systems for determination of particles in liquid samples, can solve the problems of high complexity and cost of instruments used today, and the equipment used for flow cytometry is rather elaborate and high cos
- Summary
- Abstract
- Description
- Claims
- Application Information
AI Technical Summary
Benefits of technology
Problems solved by technology
Method used
Image
Examples
example 1
Detection of Fluorescence Signals From Ethidium Bromide (EtBr) Bound to DNA in Somatic Cells in Milk at Different Initial Concentration Levels of Ethidium Bromide
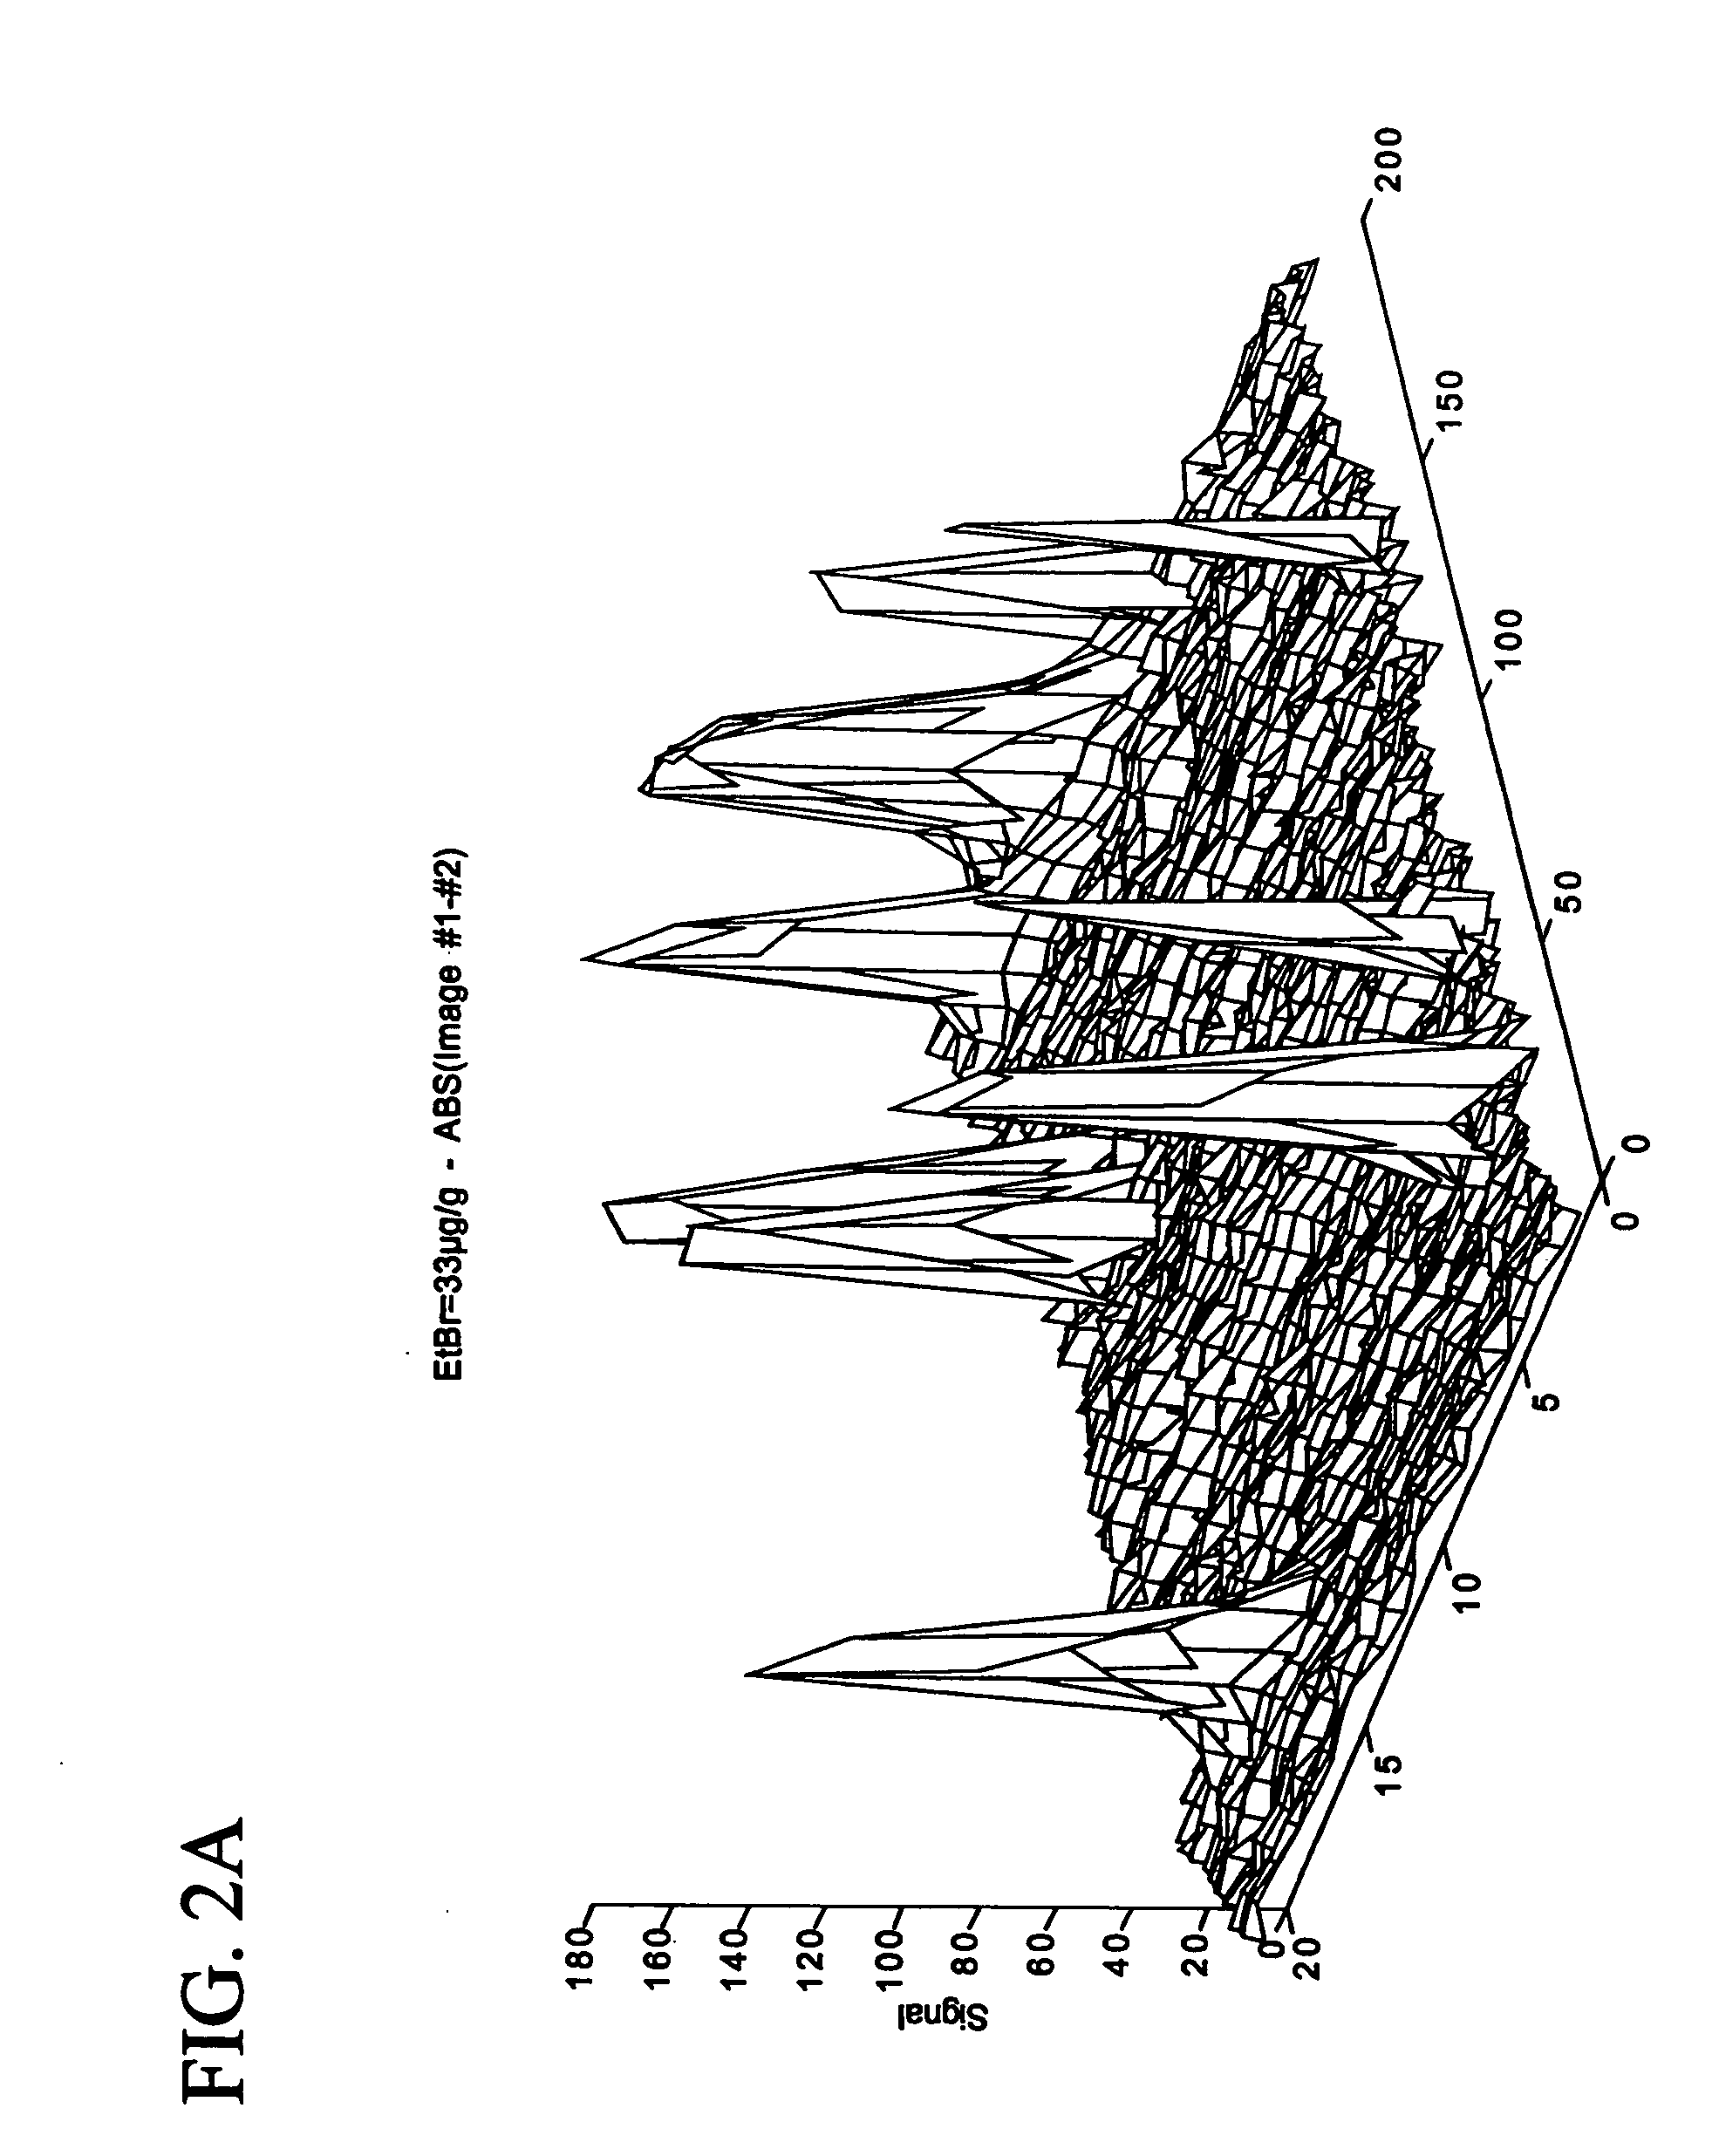
[0111] The sample material was cow bulk milk. To each of three portions of the same sample material, used for the below Experiments A, B and C, was added a buffer in the ratio of two parts by volume of buffer solution to one part by volume of milk. The buffer solutions were identical except that they contained different amounts of EtBr. The buffer solutions were prepared according to the guidelines of International IDF standard 148A: 1995—“Method C, concerning Flouro-Opto-Electronic Method” (Experiment A, EtBr concentration 33 μg / ml); for Experiment B, the concentration of EtBr was 10% of the prescribed amount, and for Experiment C, it was 1% of the prescribed amount.
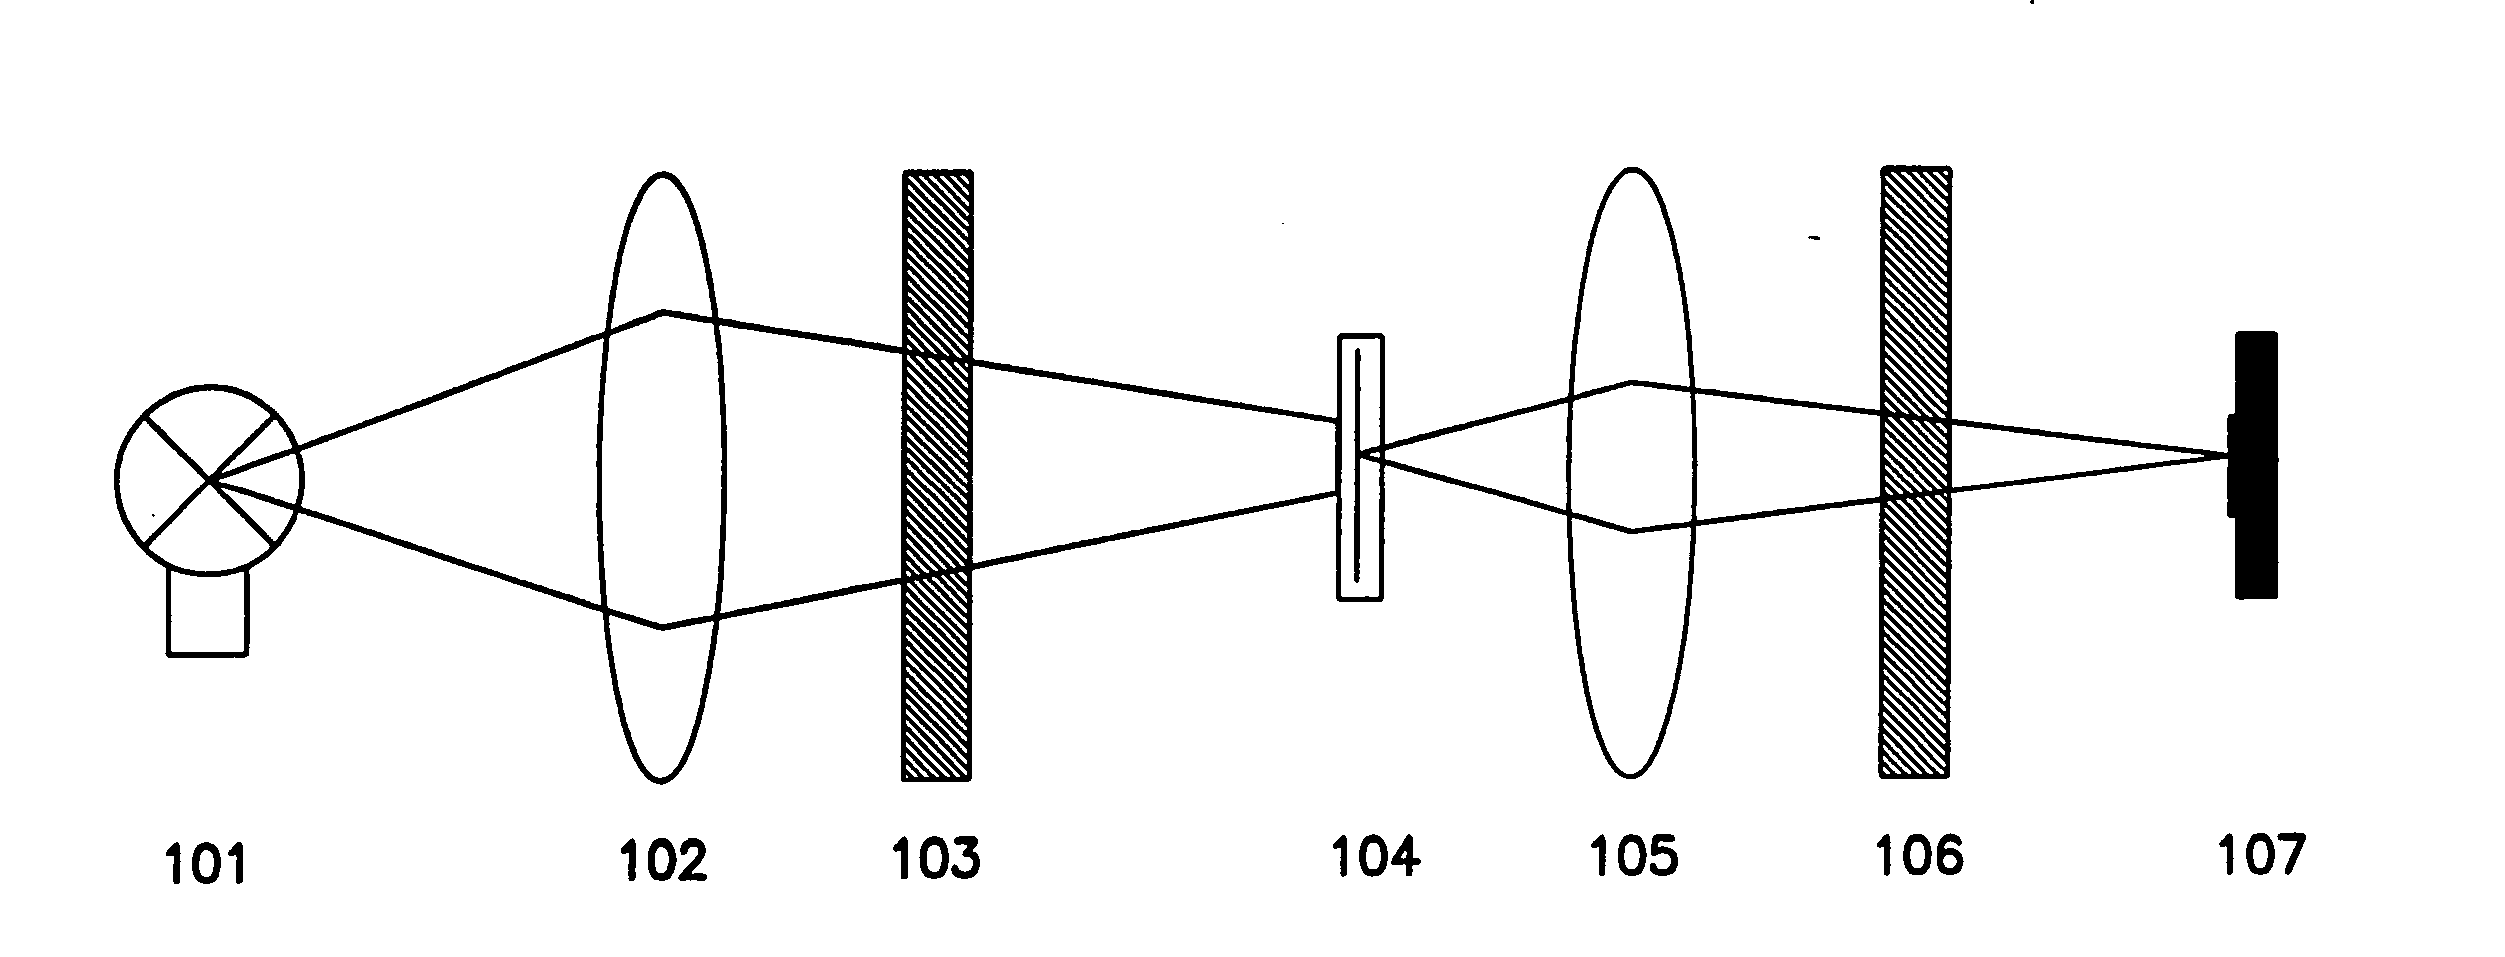
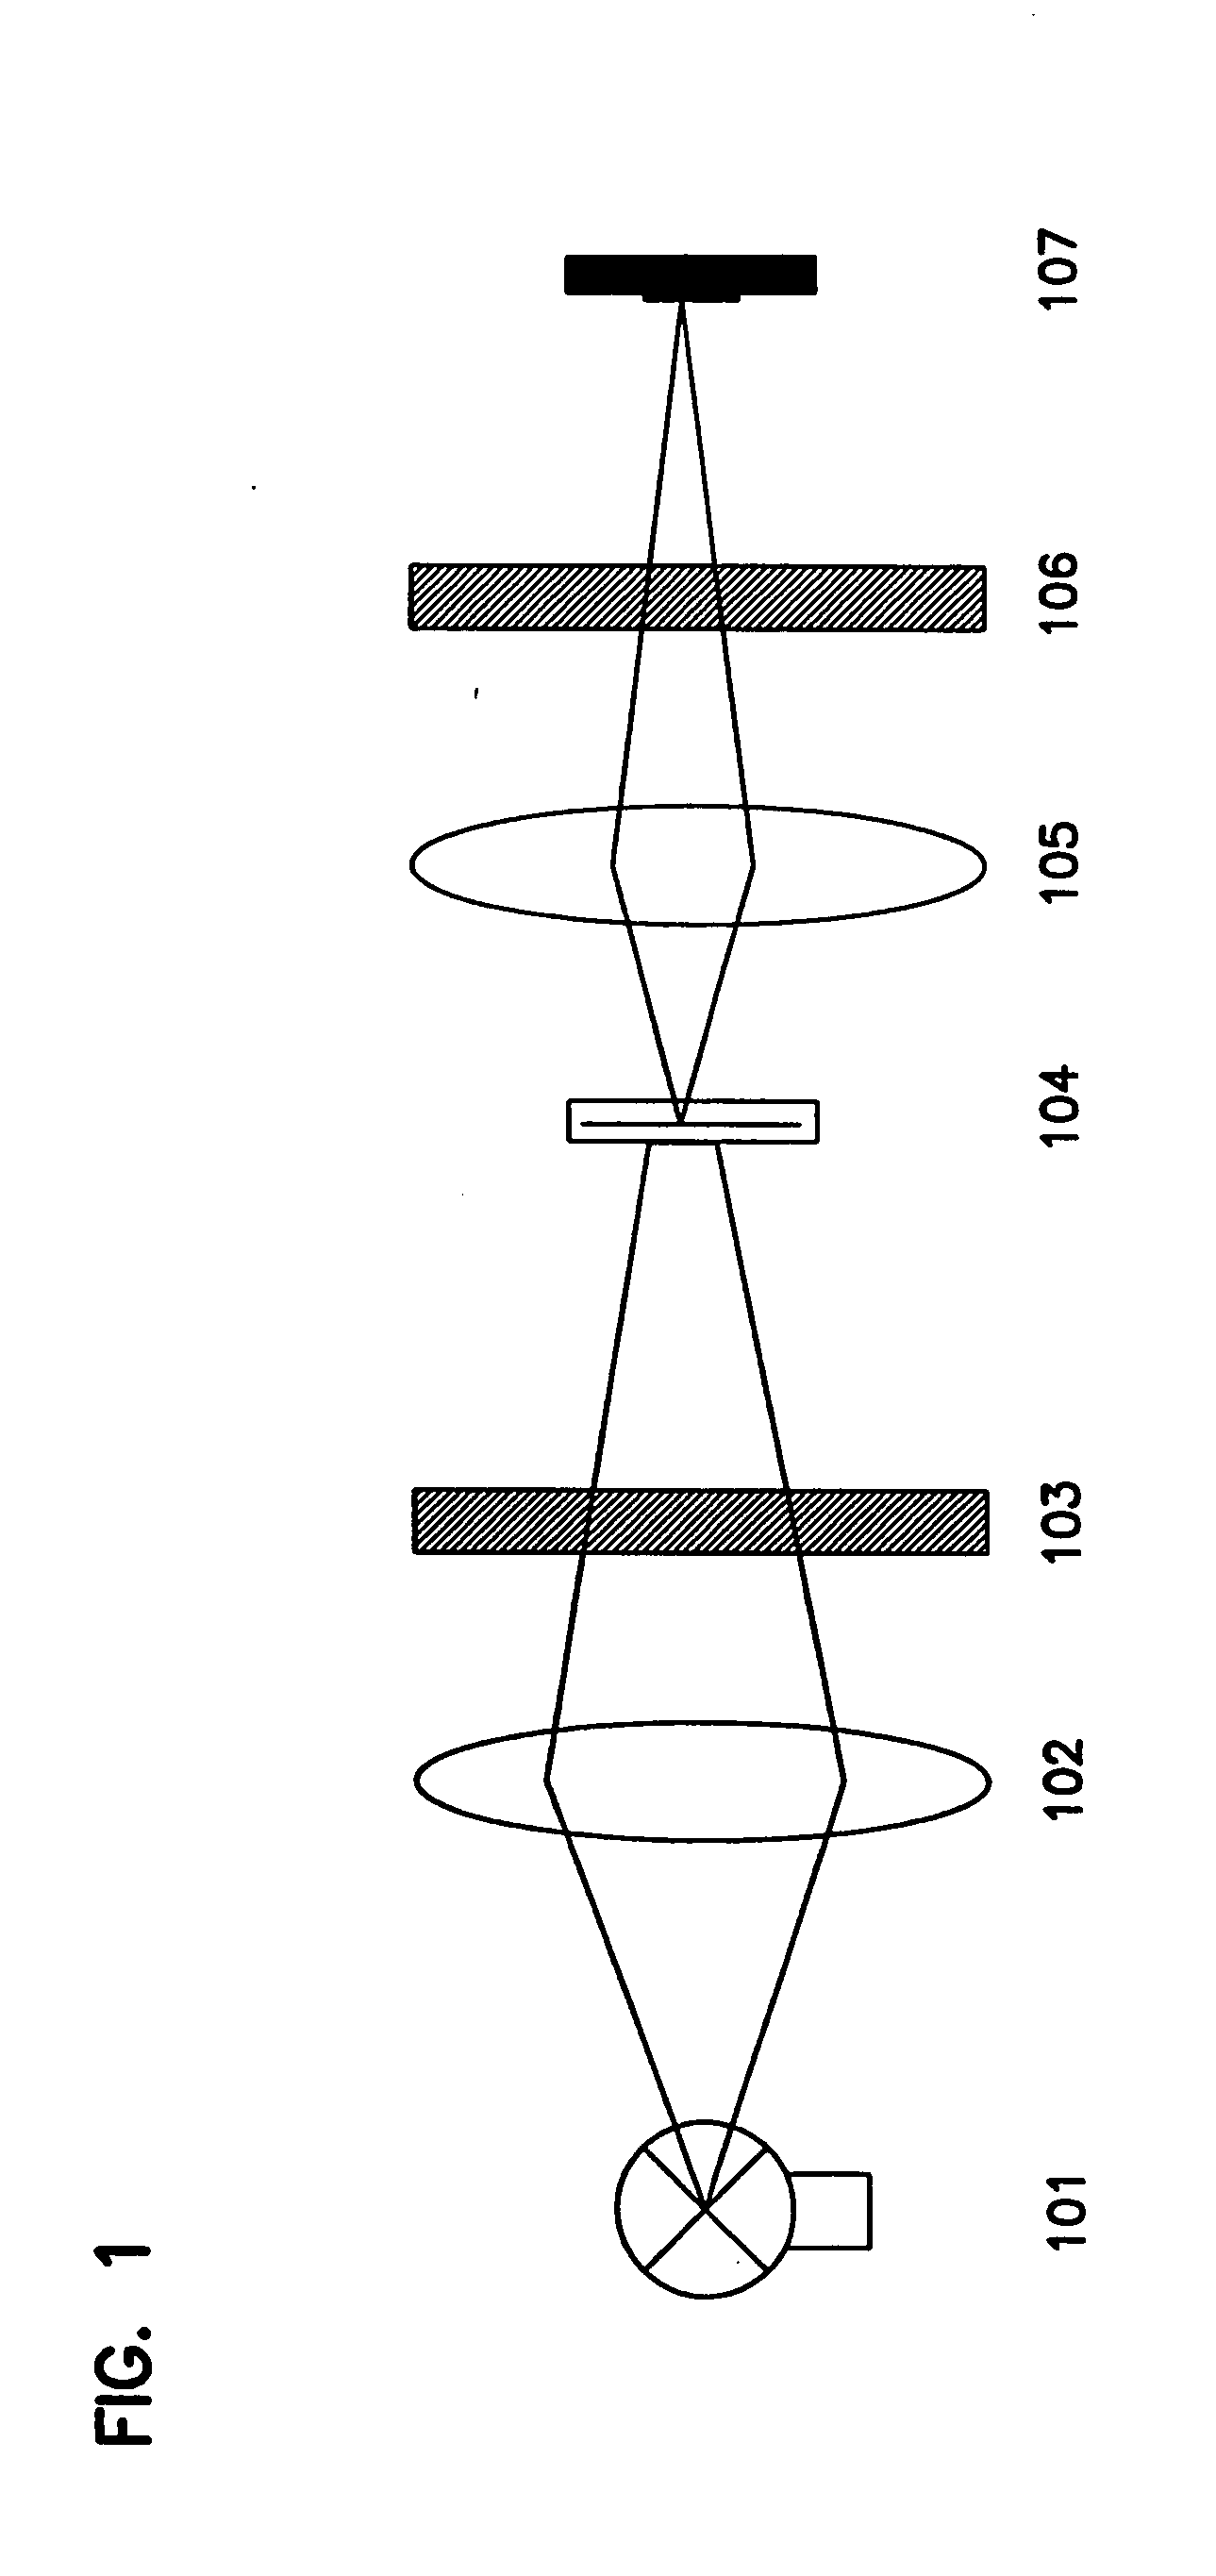
[0112] The resulting sample materials were measured in a set-up as follows (cf. FIG. 1): A halogen lamp 101 of type OSRAM (41890 SP 12V, 20 W, 10 degree refl...
example 2
Removal of Signal Bias by Combination of Measurements From a Linear Array of Detection Elements
[0122] Removal of systematic signal bias can be of interest in the processing of measured signals. In the present example a linear array of detection elements of the type Hamamatsu (S3902-128Q) was used in an arrangement similar to the one illustrated in FIG. 1. Under the conditions used, the array of detection elements gave a readout which had a systematic bias between detection elements with even index and detection elements with odd index. A series of 2 measurements was carried out using water as sample material.
Results
[0123]FIG. 3 shows the results of the measurements of water. FIG. 3A shows the result from the first measurement after the measurement had been adjusted for the mean bias. From FIG. 3A it is apparent that there is a clear difference in the signal intensity of odd and even detection elements, in that elements with an odd index have generally lower signal. FIG. 3B shows ...
example 3
Optical Configuration for Wide Angle Collection of Signal From a Sample
[0125] It can be demonstrated that the intensity of any signal collected from a sample is dependent on the square of the collection angle. In conventional automated microscopy, the collection angle is at the most 20 degrees and normally considerably lower, such as 1-5 degrees. Because of the low magnification (or no magnification) which can be used according to the present invention, and the robust processing made possible thereby, a much larger collecting angle can be used. In the present example two different optical arrangements are used to obtain a collection angle of approximately 40 and approximately 70 degrees, respectively.
[0126]FIG. 4 illustrates an optical arrangement which produces a collection angle of approximately 40 degrees when collecting a signal from a sample compartment 401 and projecting it onto detection elements 404, by using two achromatic lenses, one 402 of the type Melles Griot 01 (LAO ...
PUM
 Abstract
Description
Claims
Application Information
 - R&D
- Intellectual Property
- Life Sciences
- Materials
- Tech Scout
- Unparalleled Data Quality
- Higher Quality Content
- 60% Fewer Hallucinations
Browse by: Latest US Patents, China's latest patents, Technical Efficacy Thesaurus, Application Domain, Technology Topic, Popular Technical Reports.
© 2025 PatSnap. All rights reserved.Legal|Privacy policy|Modern Slavery Act Transparency Statement|Sitemap|About US| Contact US: help@patsnap.com


