Method and apparatus for visualizing results of root cause analysis on transaction performance data

Inactive Publication Date: 2005-11-10
IBM CORP
View PDF18 Cites 65 Cited by
  • Summary
  • Abstract
  • Description
  • Claims
  • Application Information

AI Technical Summary

Benefits of technology

[0012] In addition, the order of child nodes in the graph may be ordered based on the identity of the child nodes. Also, the number of the child nodes may be limited to a finite number in order to reduce the number of depicted child nodes such that t

Problems solved by technology

While this graph provides an indication of the manner by which a transaction is processed by the various elements of the electronic business, the graph does not provide a mechanism for isolating and detecting the root causes of problems.
Th

Method used


Image

  • Method and apparatus for visualizing results of root cause analysis on transaction performance data
  • Method and apparatus for visualizing results of root cause analysis on transaction performance data
  • Method and apparatus for visualizing results of root cause analysis on transaction performance data

Examples


Embodiment Construction

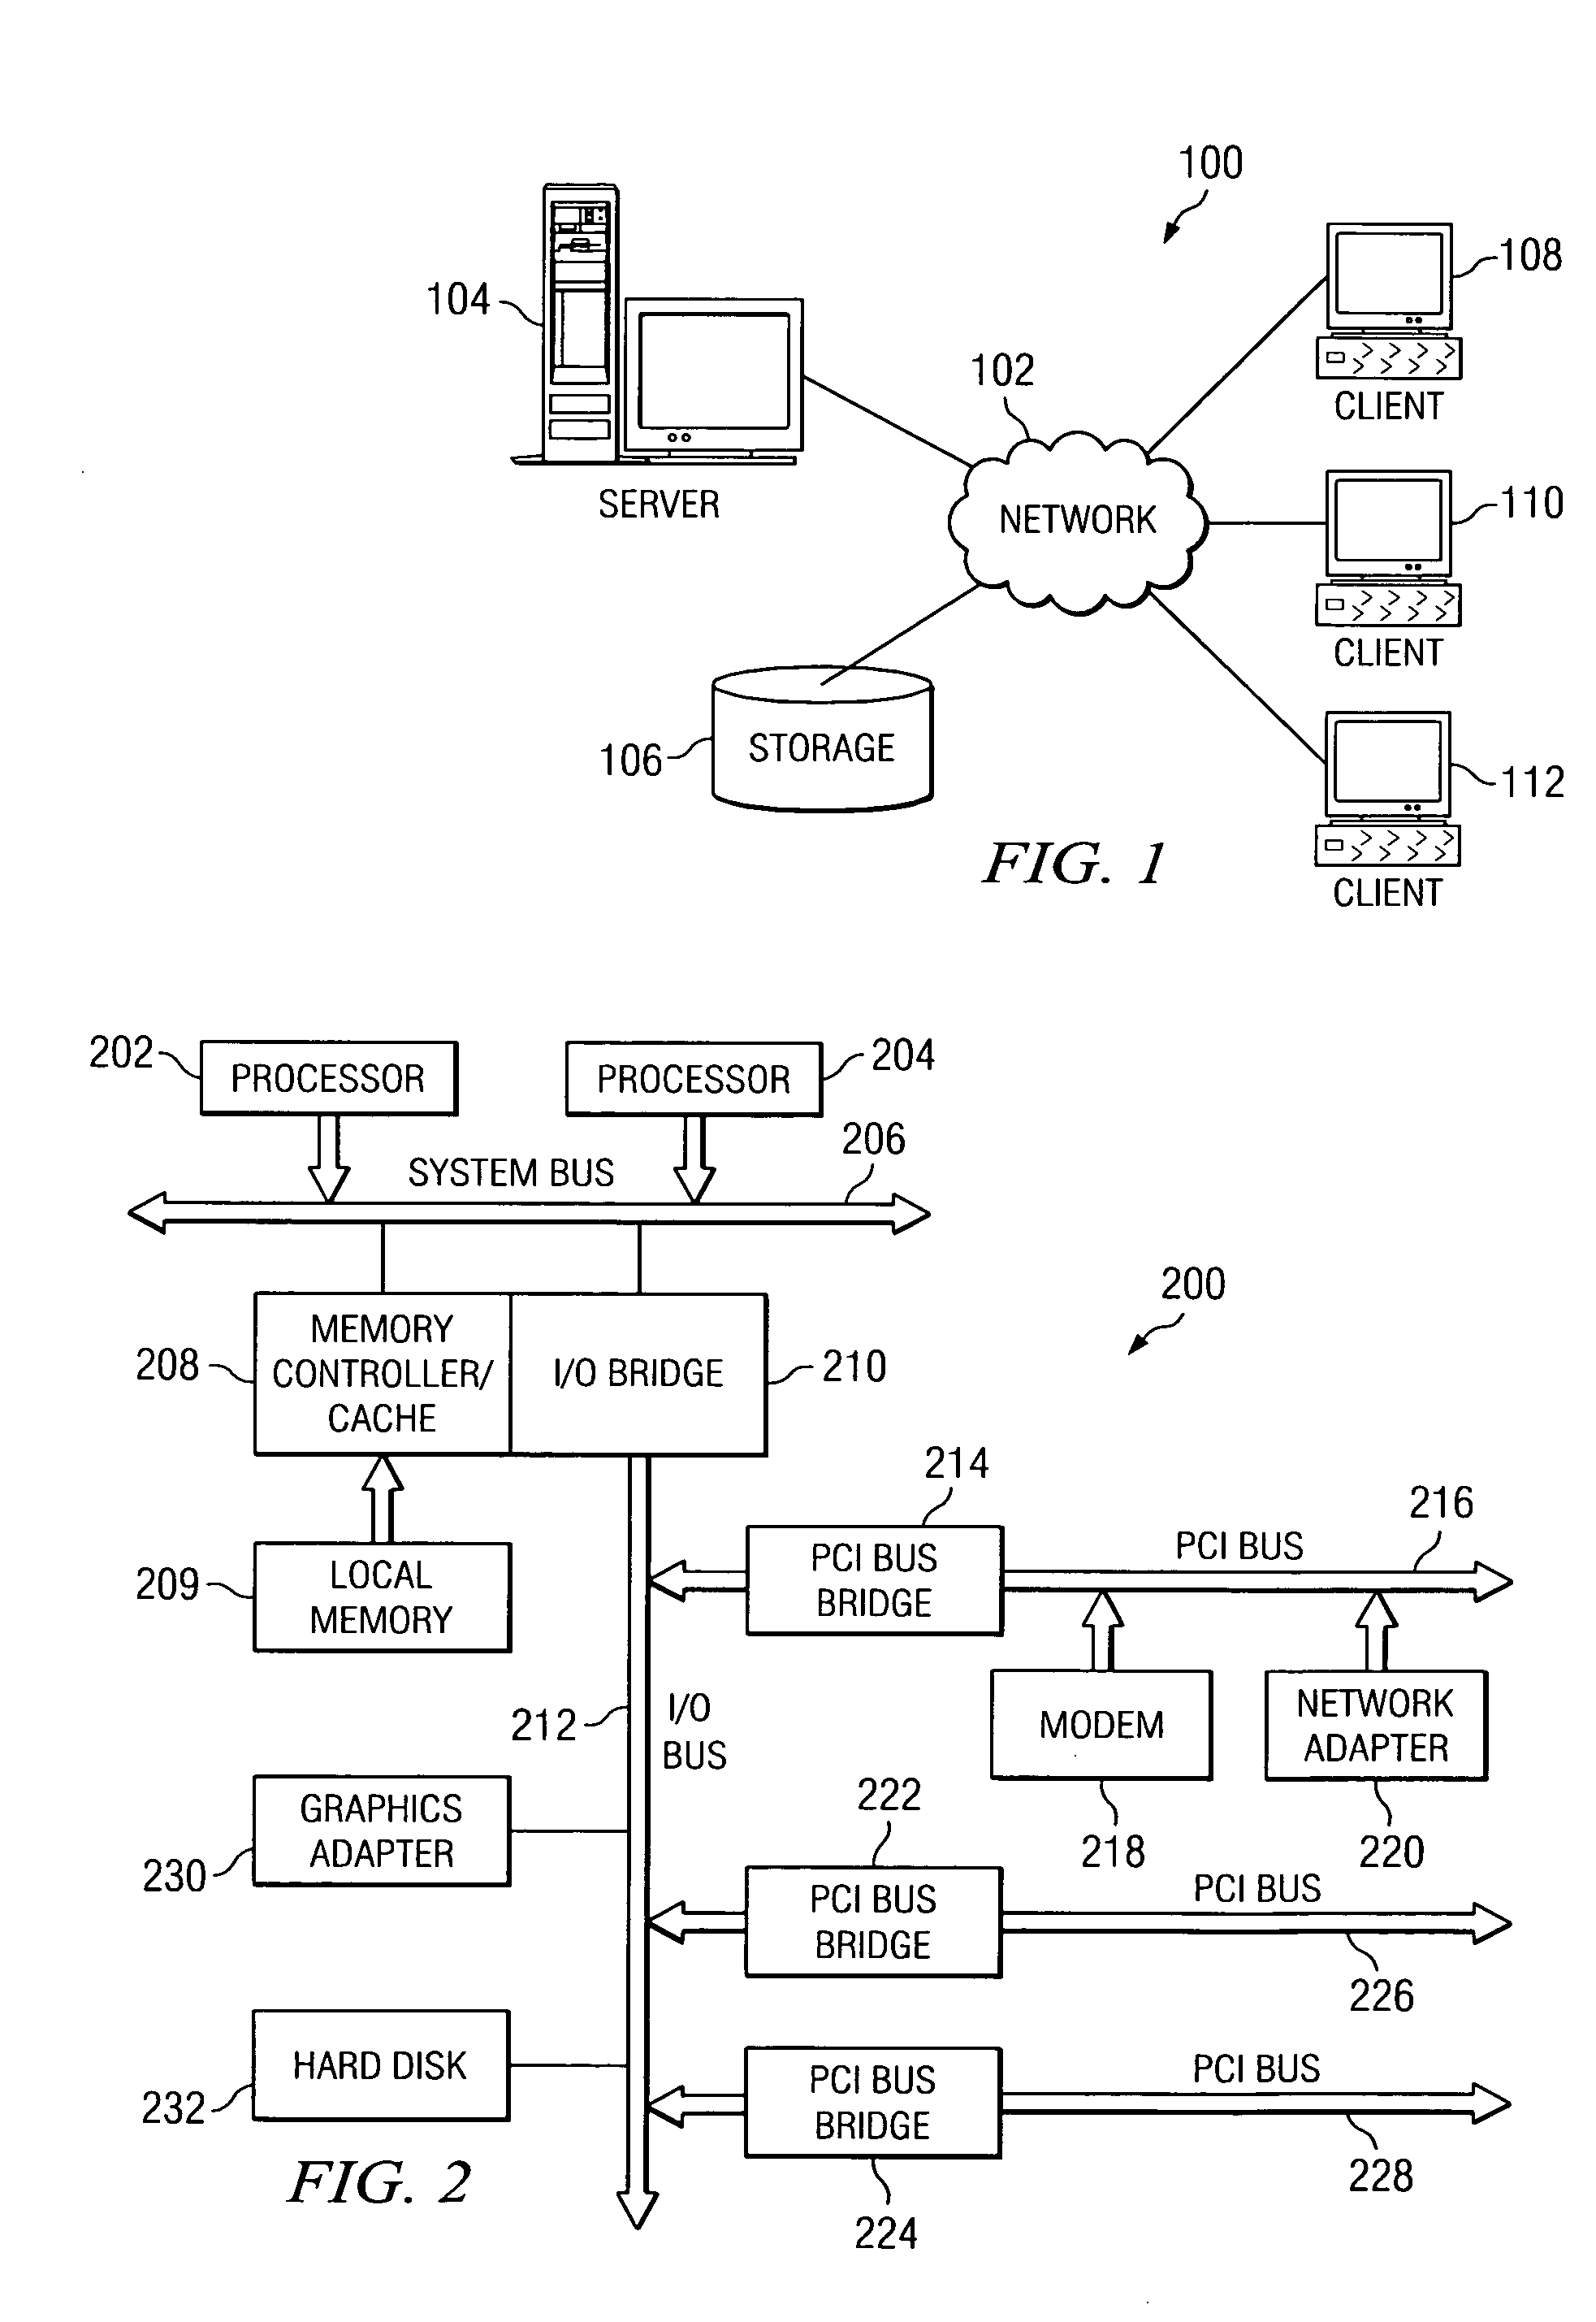
[0029] The present invention provides a mechanism for graph manipulation of transaction topology graphs so that root causes of problems in the processing of transactions are identified in the graph and emphasized. Since the present invention operates on transaction processing data for a system such as an electronic business system, the present invention is primarily directed to use with systems that are intended to operate in a distributed data processing environment, such as the Internet. Therefore, the following figures, FIGS. 1-3, are provided as example environments in which aspects of the present invention may be implemented.

[0030] With reference now to the figures, FIG. 1 depicts a pictorial representation of a network of data processing systems in which the present invention may be implemented. Network data processing system 100 is a network of computers in which the present invention may be implemented. Network data processing system 100 contains a network 102, which is the...


PUM


Abstract

Mechanisms for graph manipulation of transactional performance data are provided in order to identify and emphasize root causes of electronic business system transaction processing performance problems. A system transaction monitoring system, such as IBM Tivoli Monitoring for Transaction Performance™ (ITMTP) system, is utilized to obtain transaction performance data for a system. This transaction performance data is stored in a database and is utilized to present a graph of a given transaction or transactions. Having generated a graph of the transaction, and having identified problem conditions in the processing of the transaction(s), the present invention provides mechanisms for performing graph manipulation operations to best depict the root cause of the problems.

Description

BACKGROUND OF THE INVENTION [0001] 1. Technical Field [0002] The present invention is generally directed to a method and apparatus for visualizing results of root cause analysis on transaction performance data. More specifically, the present invention provides a plurality of graph manipulation mechanisms for providing alternative views of a transactional system architecture in order to emphasize and identify root causes of detected problems.[0003] 2. Description of Related Art [0004] IBM Tivoli Monitoring for Transaction Performance™ (hereafter ITMTP) is a centrally managed suite of software components that monitor the availability and performance of Web-based services and operating system applications. ITMTP captures detailed transaction and application performance data for all electronic business transactions. With ITMTP, every step of a customer transaction as it passes through an array of hosts, systems, application, Web and proxy servers, Web application servers, middleware, da...

Claims


Application Information

Patent Timeline
IPC IPC(8): G06F17/50
CPCG06F11/3466G06F11/3447G06Q10/0639G06F2201/87
Inventor CHAGOLY, BRYAN CHRISTOPHERSEXTON, KIRK MALCOLM
Owner IBM CORP
Why Eureka
Try Eureka