Collapsible (folding) graph

a graph and collapsible technology, applied in the field of display graphs, can solve the problems of flawed non-relevant data rejection algorithms, data collected from animal based medical research is often contaminated with non-relevant data such as noise and artifacts, and achieve the effects of reducing the length of the region gui button, reducing the number of data points, and increasing the rang

Active Publication Date: 2006-05-25
DATA SCI INT
View PDF11 Cites 29 Cited by
  • Summary
  • Abstract
  • Description
  • Claims
  • Application Information

AI Technical Summary

Benefits of technology

[0028] It is also preferable for a region GUI button to have a user adjustable length placed adjacent to and directly above the graph area. In this way, all data plotted directly under the adjustable button length is associated with the button. Therefore, the length of the button is proportional to the range of data selected. In other words, the longer the button, th

Problems solved by technology

Even in those protocols that can be automated by computer, data collected from animal based medical research is often contaminated with non-relevant data such as noise a

Method used


Image

  • Collapsible (folding) graph
  • Collapsible (folding) graph
  • Collapsible (folding) graph

Examples


Embodiment Construction

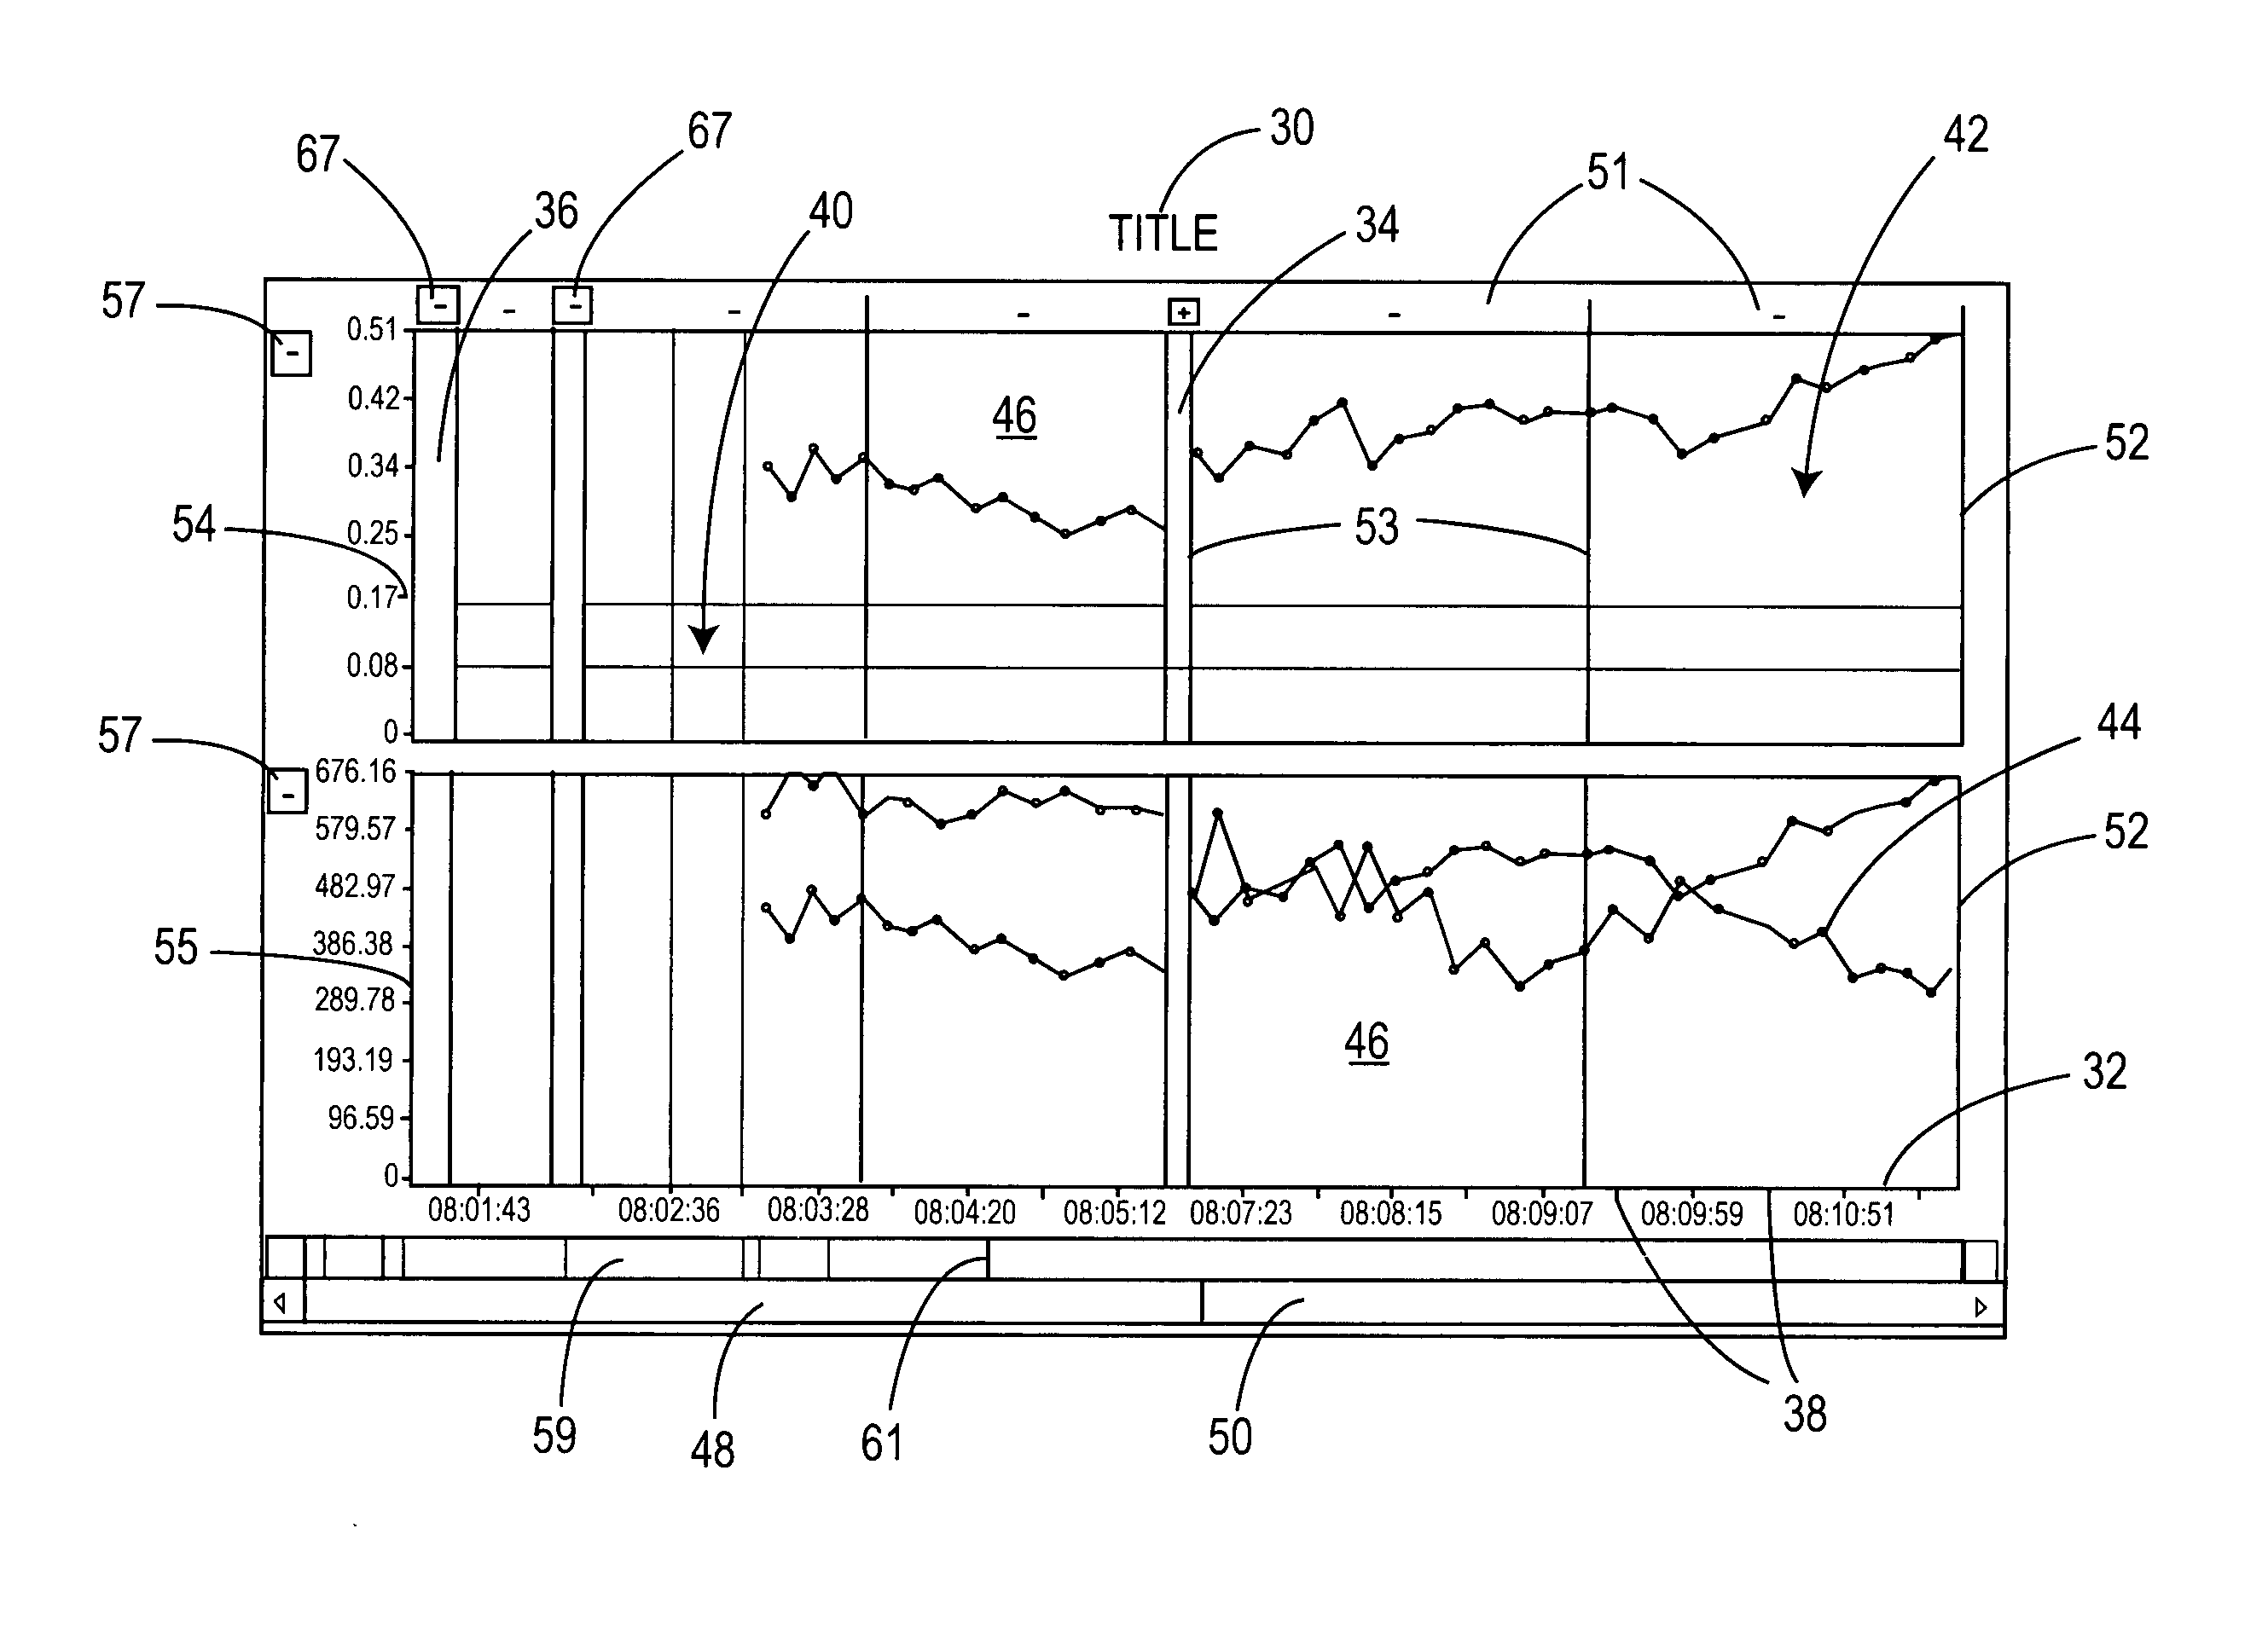
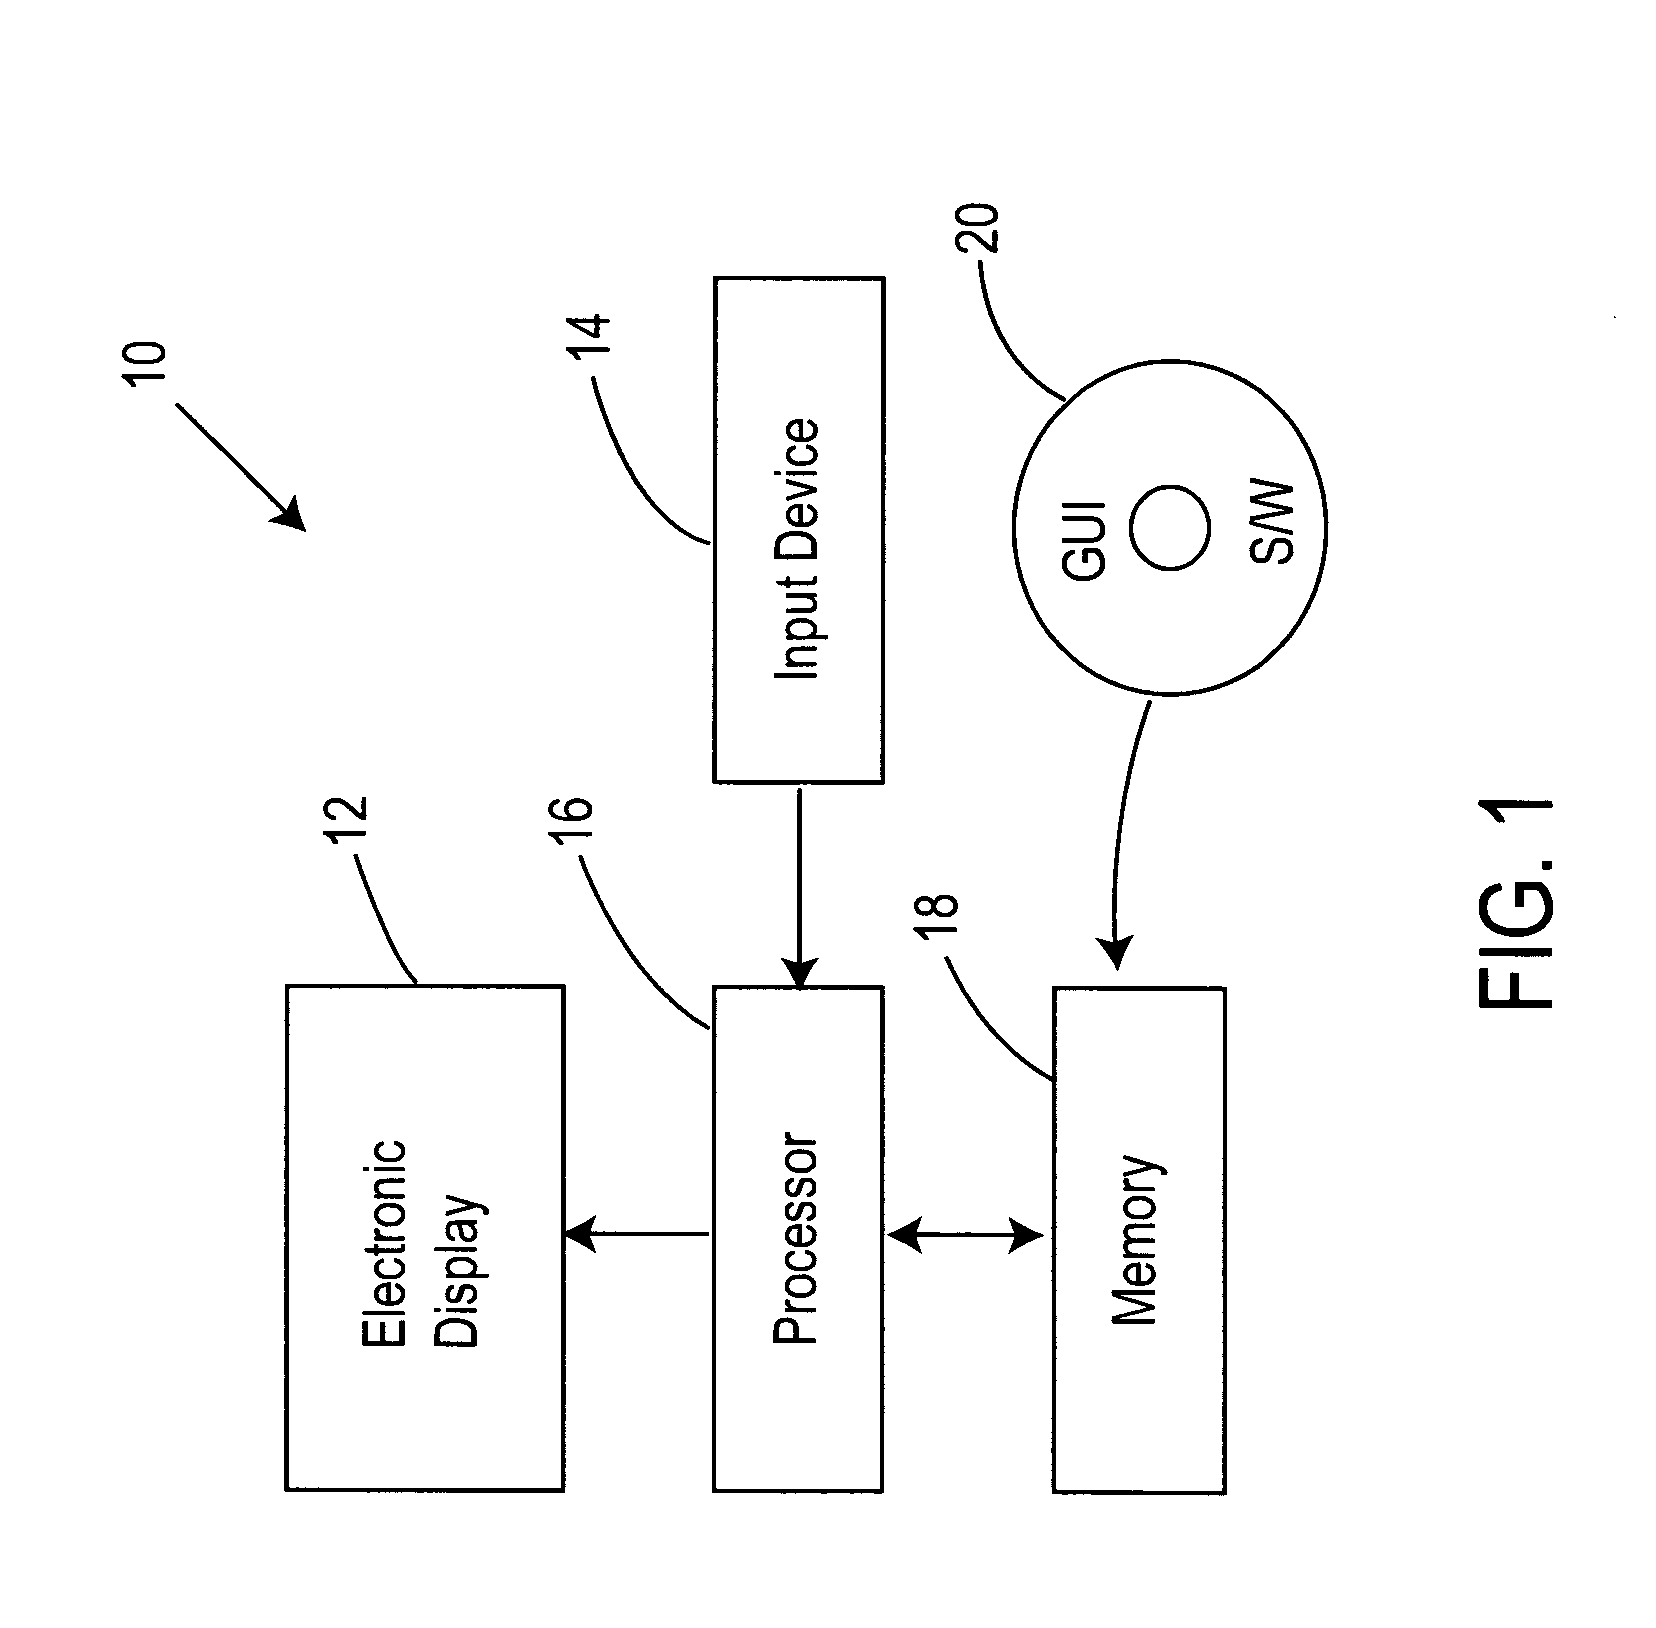
[0034]FIG. 1 depicts a system 10 for graphing a selectable range of the set of data points. The system is made up of a computerized device having an electronic display 12 for displaying the selectable range of data points, an input device 14 for receiving user input, and a digital processor 16 for processing data and a memory 18 for storing computer instructions and data. A set of graphical user interface instructions stored on software media 20 executable by digital processor 16 is stored within the memory 18.

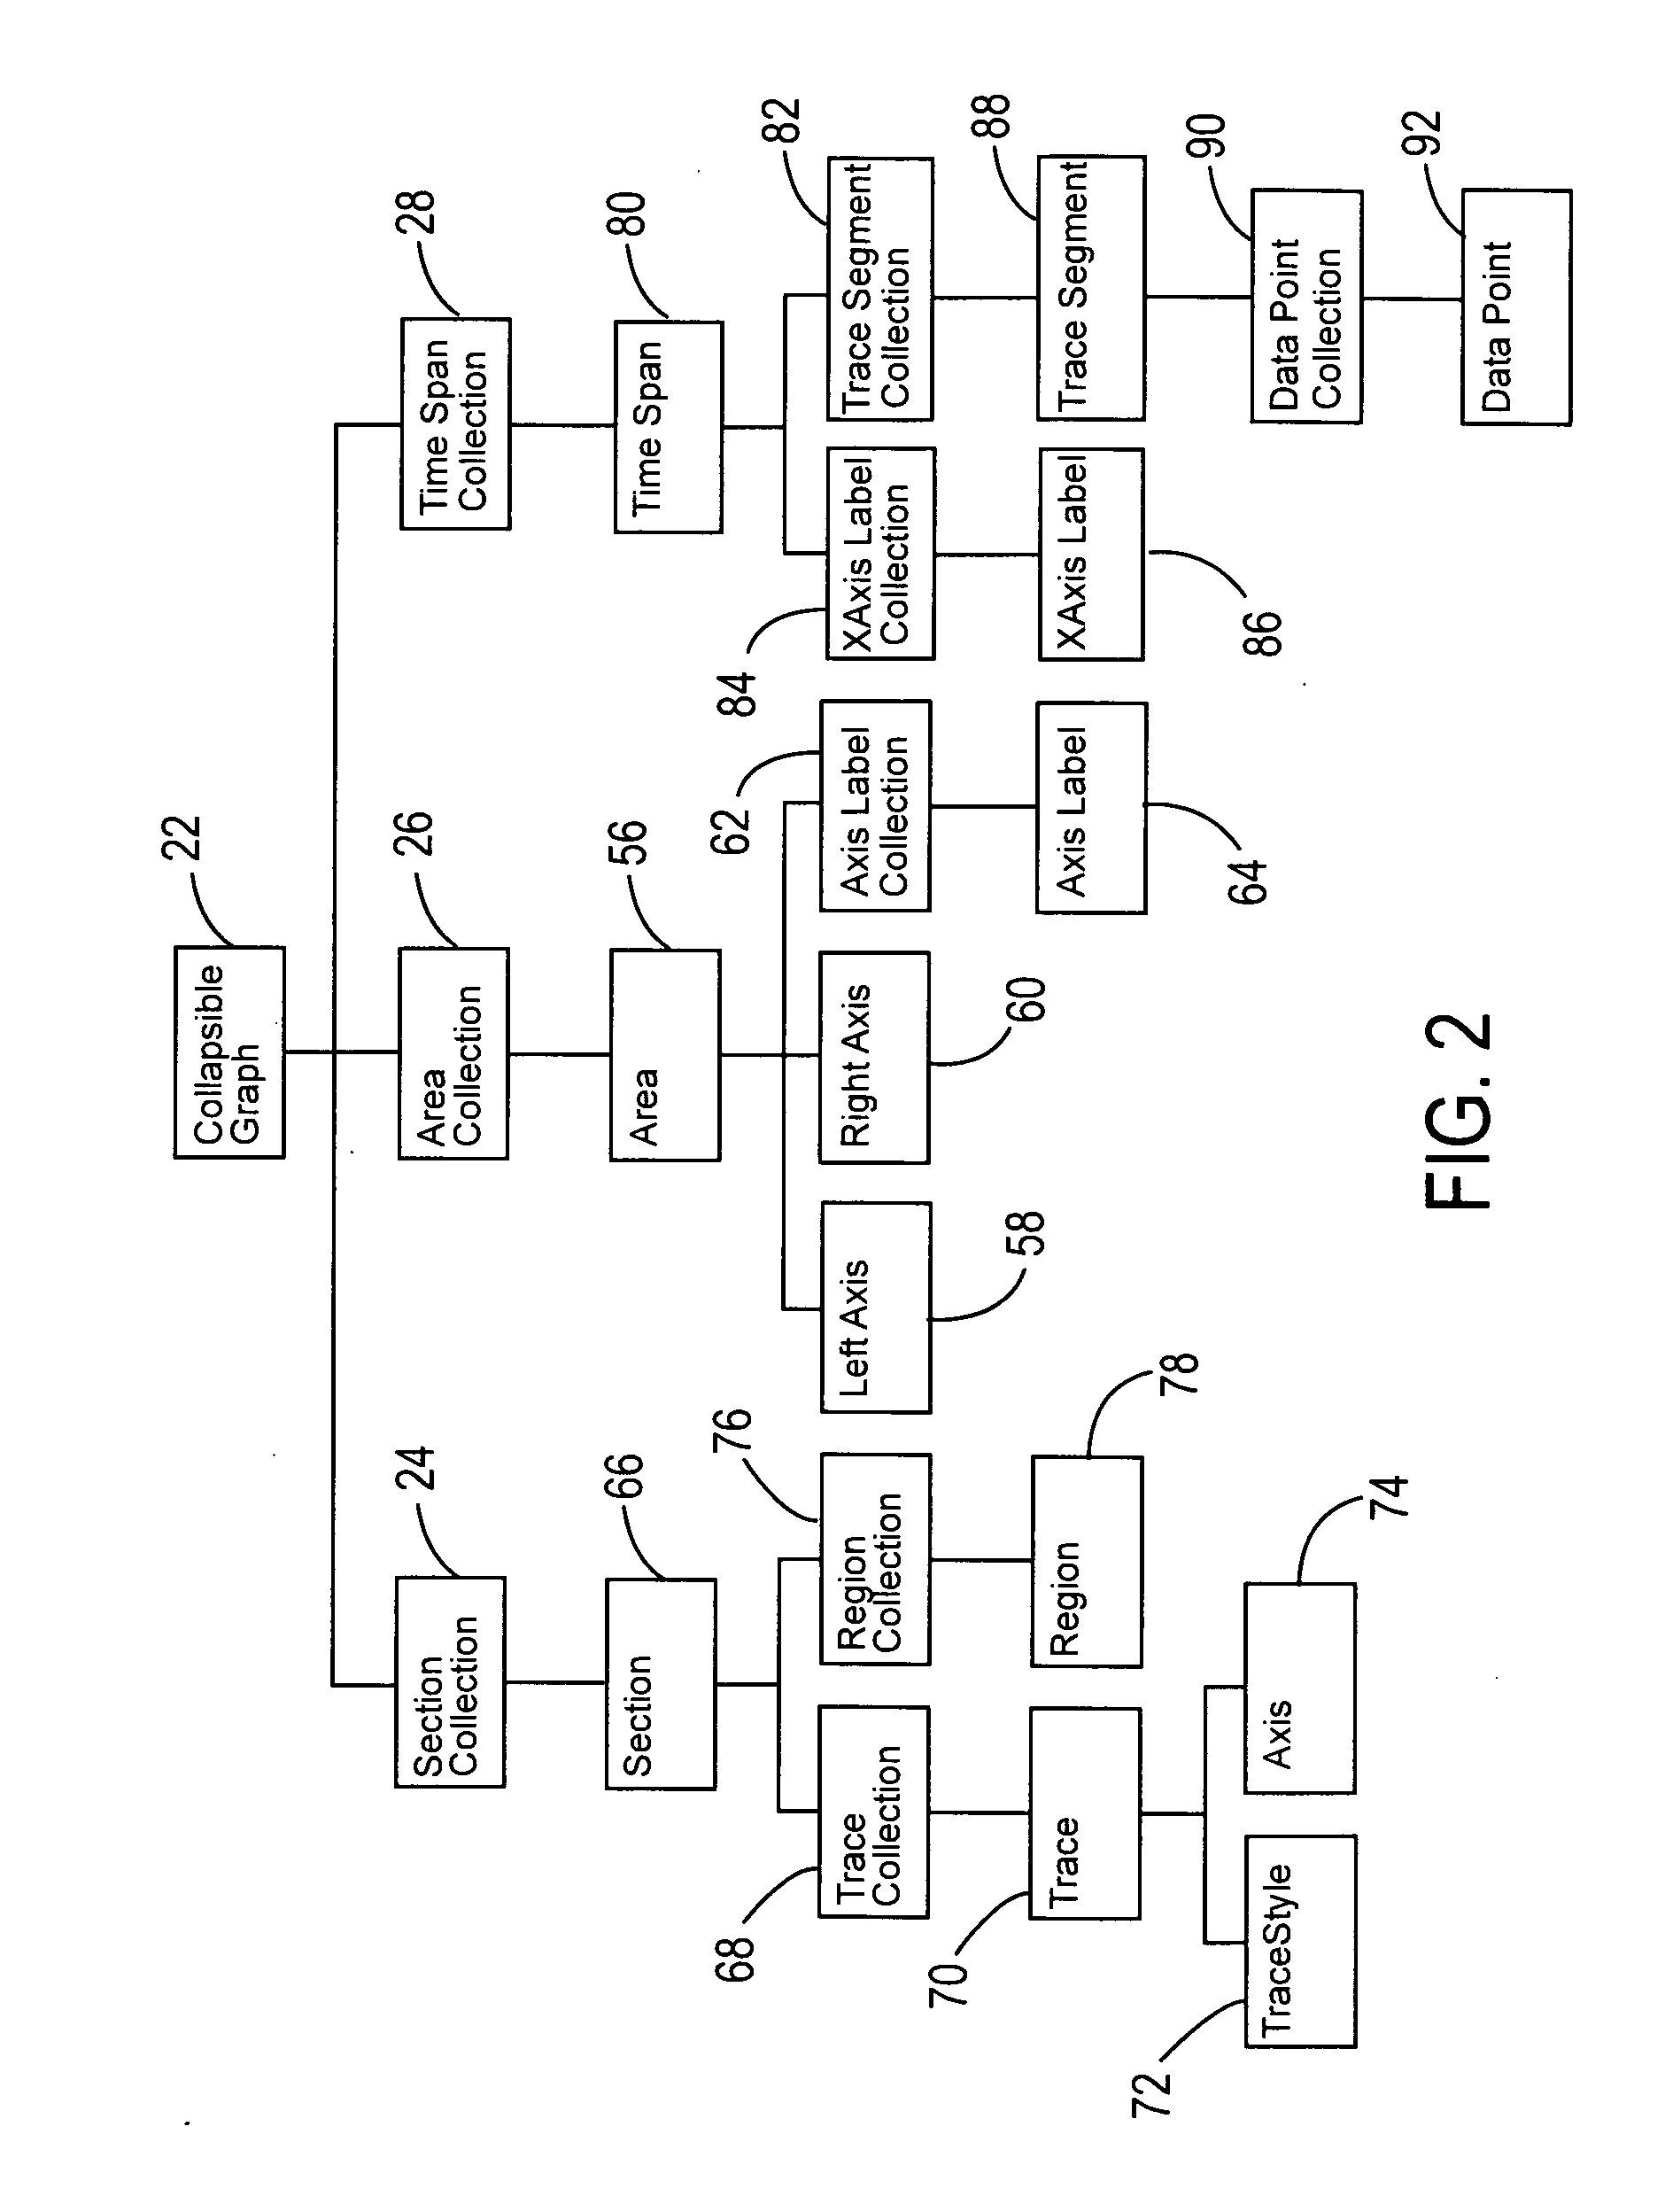
[0035] In the preferred embodiment, the method of the present invention is realized with object based or object oriented software. The overall graph control is constructed using a set of software objects or classes that define properties and behaviors of each graph presented on the electronic display.

[0036]FIG. 2 illustrates the major software objects and their relationships. Graph control object 22 is the main control for the present invention. It contains properties and me...


PUM


Abstract

Generally, the present invention is directed towards a system and method for displaying a scientific research data set viewable on an electronic display. The system is made up of a computerized device having an electronic display for displaying a selectable range of data points, an input device for receiving user input, and a digital processor for processing data and a memory for storing computer instructions and data. A set of graphical user interface instructions executable by the digital processor is stored within the memory to realize the method. The method includes steps of generating at least one data graphing area on the electronic display; graphing within the at least one data graphing area at least one line graph of data points representing at least a portion of the graphical data set; generating at least one graphical interface control for selectively rendering or removing from view a selectable range of the at least one line graph of data points; receiving input by way of the at least one graphical user interface control values indicative of the selectable range to render or remove and an indication of whether or not to render or remove from view the selectable range; and dynamically rendering or removing from view the selectable range of the at least one line graph of data points.

Description

FIELD OF THE INVENTION [0001] The present invention is directed towards displaying a graph of a numerical data set contaminated with non-relevant data known as noise. In particular, the present invention is directed towards a method and system for allowing a user to select and omit non-relevant data from a graph representing the numerical data set. Description of the Prior Art [0002] In medical and other scientific research, scientists collect large volumes of data. Although a lot of this data is archived for research, the scientists actually use only a small portion of the data for their study results. Scientists define the way they select their data in a study “protocol”. [0003] In general terms, computers can automate some protocols but not all. Those that cannot be automated by computer require a researcher to visually identify the data of interest by reviewing the data both in graph and table form. Once the data of interest has been identified, the researcher typically manually...

Claims


Application Information

Patent Timeline
IPC IPC(8): G06T11/20
CPCG06T11/206
Inventor LOMASK, JOSEPH
Owner DATA SCI INT
Why Eureka
Try Eureka